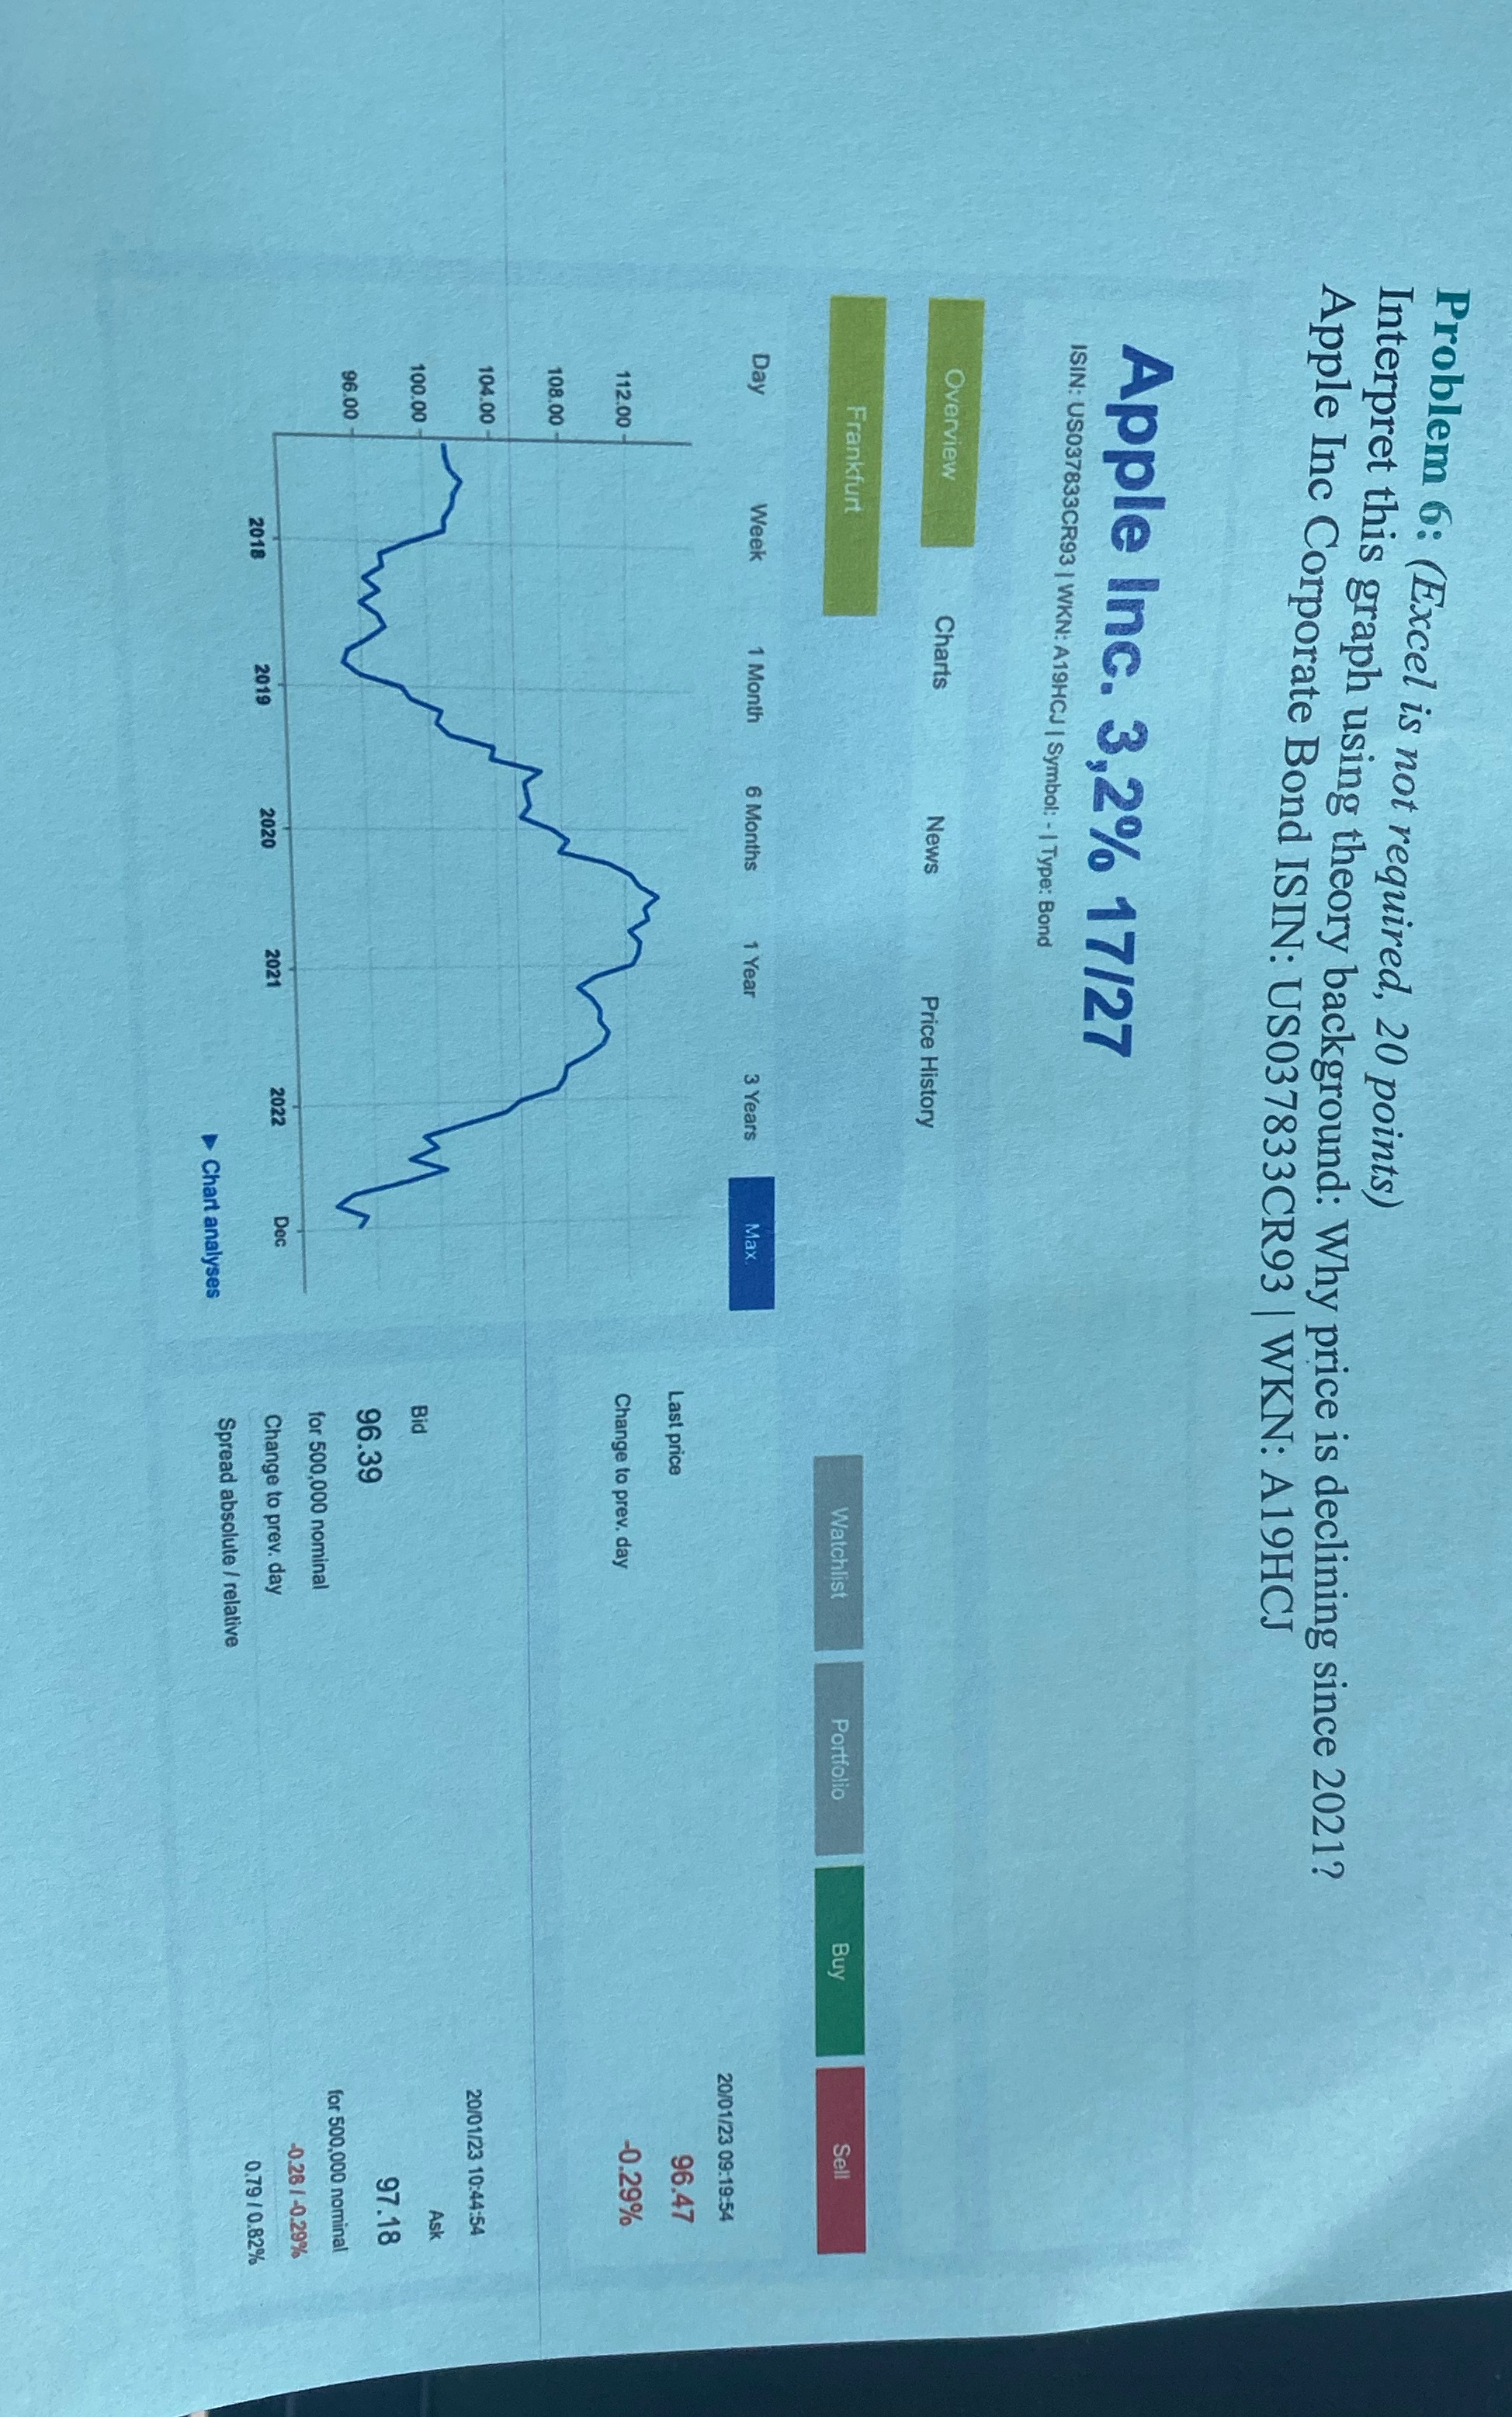
Question: Interpret this graph using theory background: Why price is declining since 2021?Apple Inc Corporate Bond ISIN: US037833CR93 | WKN: A19HCI Problem 6: (Excel is not

Interpret this graph using theory background: Why price is declining since 2021?Apple Inc Corporate Bond ISIN: US037833CR93 | WKN: A19HCI

Interpret this graph using theory background: Why
Problem 6: (Excel is not required, 20 points) Interpret this graph using theory background: Why price is declining since 2021? Apple Inc Corporate Bond ISIN: US037833CR93 | WKN: A19HCJ Apple Inc. 3,2% 17/27 ISIN: US037833CR93 | WKN: A19HCJ | Symbol: - | Type: Bond Overview Charts News Price History Frankfurt Watchlist Portfolio Buy Sell Day Week 1 Month 6 Months 1 Year 3 Years Max. 20/01/23 09:19:54 Last price 96.47 -0.29% 112.00 Change to prev. day 108.00 104.00 20/01/23 10:44:54 Ask 100.00 Bid 97.18 96.39 96.00 for 500,000 nominal for 500,000 nominal 0.28 /-0.29% 2020 2021 2022 Dec Change to prev. day 2018 2019 0.79 / 0.82% Spread absolute / relative Chart analyses

Step by Step Solution

There are 3 Steps involved in it

1 Expert Approved Answer
Step: 1 Unlock blur-text-image
Question Has Been Solved by an Expert!

Get step-by-step solutions from verified subject matter experts

Step: 2 Unlock
Step: 3 Unlock

Students Have Also Explored These Related Finance Questions!