

Question: Intro We know the following expected returns for stocks A and B, given different states of the economy State (s) Probability E(TA,s) E(TB,s) Recession 0.2
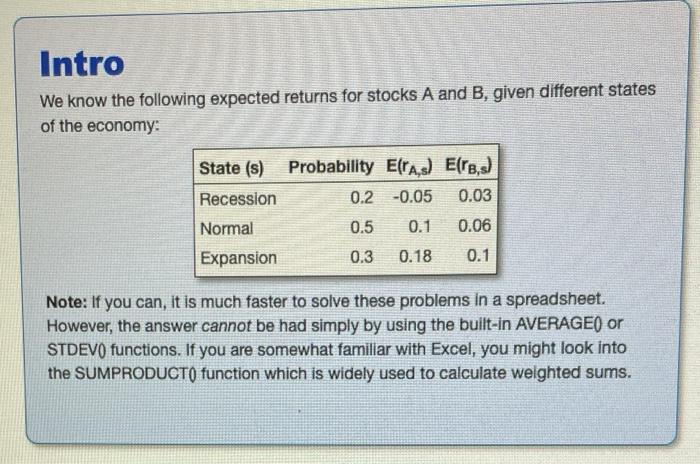
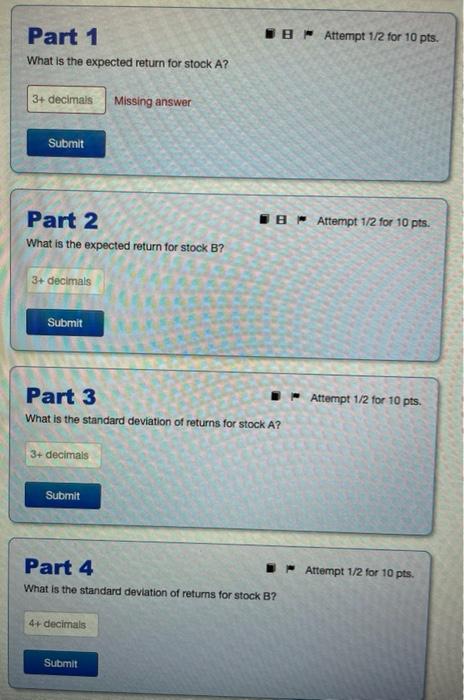
Intro We know the following expected returns for stocks A and B, given different states of the economy State (s) Probability E(TA,s) E(TB,s) Recession 0.2 -0.05 0.03 Normal 0.06 Expansion 0:3 ore 0.1 Note: If you can, it is much faster to solve these problems in a spreadsheet. However, the answer cannot be had simply by using the built-in AVERAGE() or STDEVO functions. If you are somewhat familiar with Excel, you might look into the SUMPRODUCTO function which is widely used to calculate welghted sums. Part 1 B Attempt 1/2 for 10 pts. What is the expected return for stock A? 3+ decimals Missing answer Submit Part 2 O Attempt 1/2 for 10 pts. What is the expected return for stock B? 3+ decimals Submit Part 3 . Attempt 1/2 for 10 pts. What is the standard deviation of returns for stock A? 3+ decimals Submit Attempt 1/2 for 10 pts. Part 4 What is the standard deviation of returns for stock B? 4+ decimals Submit
Step by Step Solution
There are 3 Steps involved in it

Get step-by-step solutions from verified subject matter experts