

Question: Investment Asset Pricing Assignment INSTRUCTIONS This assignment is designed for you to demonstrate your understanding of asset pricing. Ensure that you download a copy of
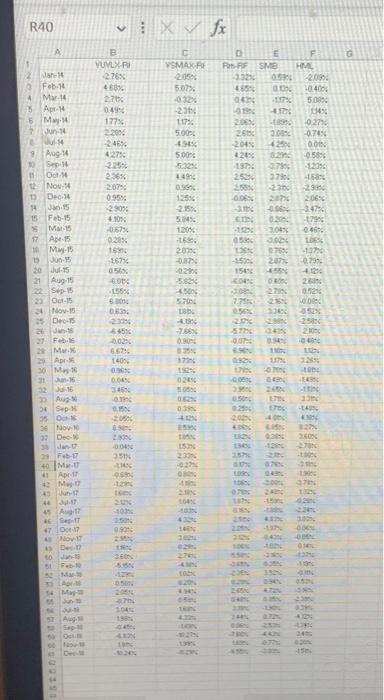
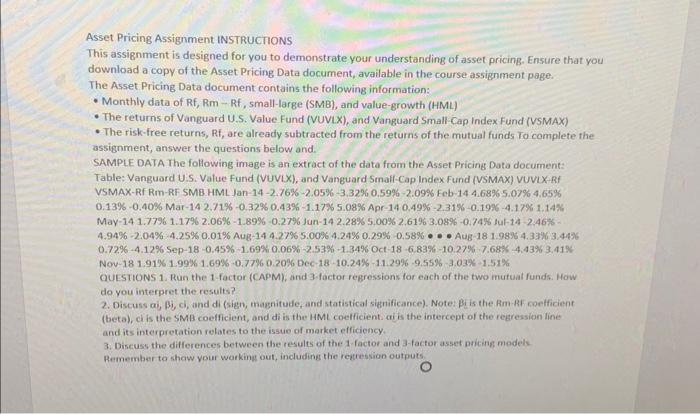
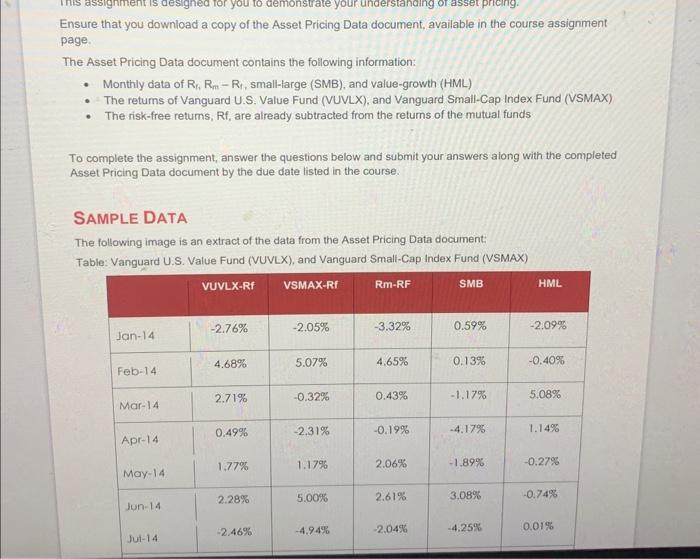
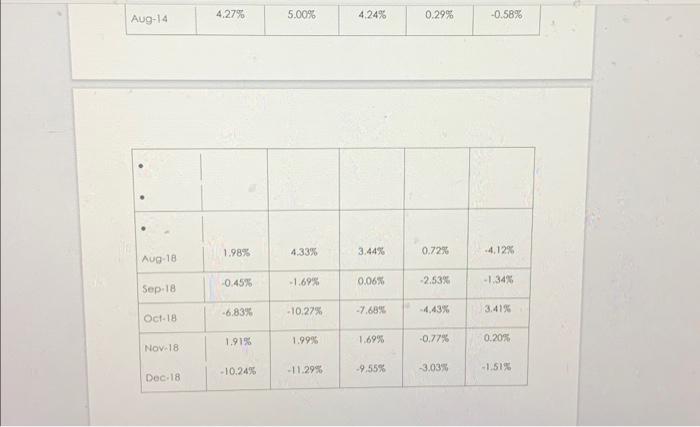
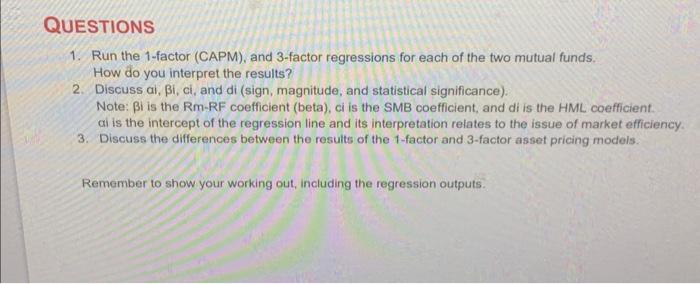
Asset Pricing Assignment INSTRUCTIONS This assignment is designed for you to demonstrate your understanding of asset pricing. Ensure that you download a copy of the Asset Pricing Data document, available in the course assignment page. The Asset Pricing Data document contains the following information: - Monthly data of Rf, Rm - Rf, small-large (SMB), and value-growth (HML) - The returns of Vanguard U.S. Value Fund (VUVIX), and Vanguard Small-Cap Index Fund (VSMAX) - The risk-free returns, Rf, are already subtracted from the returns of the mutual funds To complete the assignment, answer the questions below and. SAMPLE DATA The following image is an extract of the data from the Asset Pricing Data document: Table: Vanguard U.S. Value Fund (VUVLX), and Vanguard Smalf-Cap Index Fund (VSMAX) VUVIX-RI VSMAX-Rf Rm-RF SMB HML Jan-14-2.76\%-2.05\%-3.32\% 0.59%2.09% Feb-14 4.68\% 5.07\% 4.65% 0.13%0.40% Mar-14 2.71\%-0.32\% 0.43\%-1.17\% 5.08\% Apr-14 0.49\%-2.31\%-0.19\% 4.17%1.14% May-14 1.7796 1.17\% 2.06\%-1.89\% - 0.27\% Jun-14 2.28\% 5.00\% 2.61963.08\% - 0.74% tul-14 -2.46\%4.94%2.04%4.25%0.01% Aug-14 4.27\% 5.00%4.24%0.29%0.58% Aug-18 1.98\% 4.33\% 3.44\% 0.72%4.12% Sep-18-0.45\%-1.69\% 0.06%2.53%1.34% oct 186.83%10.27%7.68%4.43%3.41% Nov-18 1.91\% 1.99%1.69%0.77%0.20% Dec-18-10.24\%-11.29\% 9.55%3.03%1.51% QUESIIONS 1. Run the 1-factor (CAPM), and 3.factor regressions for each of the two mutuat funds. How do you interpret the results? 2. Discuss , i, d, and di (sign, magnitude, and statistical significance). Note: i is the Rm- RF nelficient (beta), ci is the SMB coelficient, and di is the HML coefficient ais the intercept of the regression line and its interpretation relates to the issue of market efficiency. 3. Discuss the differences between the results of the 1 factor and 3 -factor asset pricing medels Remember to shaw your workint out, including the regtession outputs Ensure that you download a copy of the Asset Pricing Data document, available in the course assignment page. The Asset Pricing Data document contains the following information: - Monthly data of Rr,RmRr, small-large (SMB), and value-growth (HML) - The retums of Vanguard U.S. Value Fund (VUVLX), and Vanguard Small-Cap Index Fund (VSMAX) - The risk-free retums, Rf, are already subtracted from the retums of the mutual funds To complete the assignment, answer the questions below and submit your answers along with the completed Asset Pricing Data document by the due date listed in the course. SAMPLE DATA The following image is an extract of the data from the Asset Pricing Data document: Table: Vanquard U.S. Value Fund (VUVLX), and Vanguard Small-Cap Index Fund (VSMAX) \begin{tabular}{|l|l|l|l|l|l|} \hline Aug-14 & 4.27% & 5.00% & 4.24% & 0.29% & 0.58% \\ \hline \end{tabular} QUESTIONS 1. Run the 1-factor (CAPM), and 3-factor regressions for each of the two mutual funds. How do you interpret the results? 2. Discuss ai, i, ci, and di (sign, magnitude, and statistical significance). Note: i is the Rm-RF coefficient (beta), ci is the SMB coefficient, and di is the HML coefficient. ai is the intercept of the regression line and its interpretation relates to the issue of market efficiency. 3. Discuss the differences between the results of the 1 -factor and 3 -factor asset pricing models. Remember to show your working out, including the regression outputs. Asset Pricing Assignment INSTRUCTIONS This assignment is designed for you to demonstrate your understanding of asset pricing. Ensure that you download a copy of the Asset Pricing Data document, available in the course assignment page. The Asset Pricing Data document contains the following information: - Monthly data of Rf, Rm - Rf, small-large (SMB), and value-growth (HML) - The returns of Vanguard U.S. Value Fund (VUVIX), and Vanguard Small-Cap Index Fund (VSMAX) - The risk-free returns, Rf, are already subtracted from the returns of the mutual funds To complete the assignment, answer the questions below and. SAMPLE DATA The following image is an extract of the data from the Asset Pricing Data document: Table: Vanguard U.S. Value Fund (VUVLX), and Vanguard Smalf-Cap Index Fund (VSMAX) VUVIX-RI VSMAX-Rf Rm-RF SMB HML Jan-14-2.76\%-2.05\%-3.32\% 0.59%2.09% Feb-14 4.68\% 5.07\% 4.65% 0.13%0.40% Mar-14 2.71\%-0.32\% 0.43\%-1.17\% 5.08\% Apr-14 0.49\%-2.31\%-0.19\% 4.17%1.14% May-14 1.7796 1.17\% 2.06\%-1.89\% - 0.27\% Jun-14 2.28\% 5.00\% 2.61963.08\% - 0.74% tul-14 -2.46\%4.94%2.04%4.25%0.01% Aug-14 4.27\% 5.00%4.24%0.29%0.58% Aug-18 1.98\% 4.33\% 3.44\% 0.72%4.12% Sep-18-0.45\%-1.69\% 0.06%2.53%1.34% oct 186.83%10.27%7.68%4.43%3.41% Nov-18 1.91\% 1.99%1.69%0.77%0.20% Dec-18-10.24\%-11.29\% 9.55%3.03%1.51% QUESIIONS 1. Run the 1-factor (CAPM), and 3.factor regressions for each of the two mutuat funds. How do you interpret the results? 2. Discuss , i, d, and di (sign, magnitude, and statistical significance). Note: i is the Rm- RF nelficient (beta), ci is the SMB coelficient, and di is the HML coefficient ais the intercept of the regression line and its interpretation relates to the issue of market efficiency. 3. Discuss the differences between the results of the 1 factor and 3 -factor asset pricing medels Remember to shaw your workint out, including the regtession outputs Ensure that you download a copy of the Asset Pricing Data document, available in the course assignment page. The Asset Pricing Data document contains the following information: - Monthly data of Rr,RmRr, small-large (SMB), and value-growth (HML) - The retums of Vanguard U.S. Value Fund (VUVLX), and Vanguard Small-Cap Index Fund (VSMAX) - The risk-free retums, Rf, are already subtracted from the retums of the mutual funds To complete the assignment, answer the questions below and submit your answers along with the completed Asset Pricing Data document by the due date listed in the course. SAMPLE DATA The following image is an extract of the data from the Asset Pricing Data document: Table: Vanquard U.S. Value Fund (VUVLX), and Vanguard Small-Cap Index Fund (VSMAX) \begin{tabular}{|l|l|l|l|l|l|} \hline Aug-14 & 4.27% & 5.00% & 4.24% & 0.29% & 0.58% \\ \hline \end{tabular} QUESTIONS 1. Run the 1-factor (CAPM), and 3-factor regressions for each of the two mutual funds. How do you interpret the results? 2. Discuss ai, i, ci, and di (sign, magnitude, and statistical significance). Note: i is the Rm-RF coefficient (beta), ci is the SMB coefficient, and di is the HML coefficient. ai is the intercept of the regression line and its interpretation relates to the issue of market efficiency. 3. Discuss the differences between the results of the 1 -factor and 3 -factor asset pricing models. Remember to show your working out, including the regression outputs
Step by Step Solution
There are 3 Steps involved in it

Get step-by-step solutions from verified subject matter experts