

Question: The data in the table is from the second problem of ICE 6. Now assume that the standard deviation of each activity is 30% of
The data in the table is from the second problem of ICE 6. Now assume that the standard deviation of each activity is 30% of the activity time; so for A, the standard deviation is 30%*5 = 1.5, for B, the standard deviation is 30%*10 = 3, etc.
Simulate this networks completion time at least 2500 times in Excel and then estimate the answers below.
1.) Graph and attach a cool graph that displays the distribution of the completion times.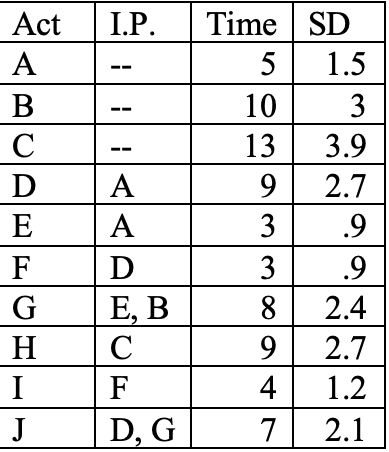
\begin{tabular}{|l|l|r|r|} \hline Act & I.P. & Time & SD \\ \hline A & -- & 5 & 1.5 \\ \hline B & -- & 10 & 3 \\ \hline C & -- & 13 & 3.9 \\ \hline D & A & 9 & 2.7 \\ \hline E & A & 3 & .9 \\ \hline F & D & 3 & .9 \\ \hline G & E,B & 8 & 2.4 \\ \hline H & C & 9 & 2.7 \\ \hline I & F & 4 & 1.2 \\ \hline J & D,G & 7 & 2.1 \\ \hline \end{tabular} \begin{tabular}{|l|l|r|r|} \hline Act & I.P. & Time & SD \\ \hline A & -- & 5 & 1.5 \\ \hline B & -- & 10 & 3 \\ \hline C & -- & 13 & 3.9 \\ \hline D & A & 9 & 2.7 \\ \hline E & A & 3 & .9 \\ \hline F & D & 3 & .9 \\ \hline G & E,B & 8 & 2.4 \\ \hline H & C & 9 & 2.7 \\ \hline I & F & 4 & 1.2 \\ \hline J & D,G & 7 & 2.1 \\ \hline \end{tabular}
Step by Step Solution
There are 3 Steps involved in it

Get step-by-step solutions from verified subject matter experts