

Question: IRR n A B C D E A vs. B -7% 0 -176,000 A VS. C 5% 1 A vs. D 2% 2 A vs.
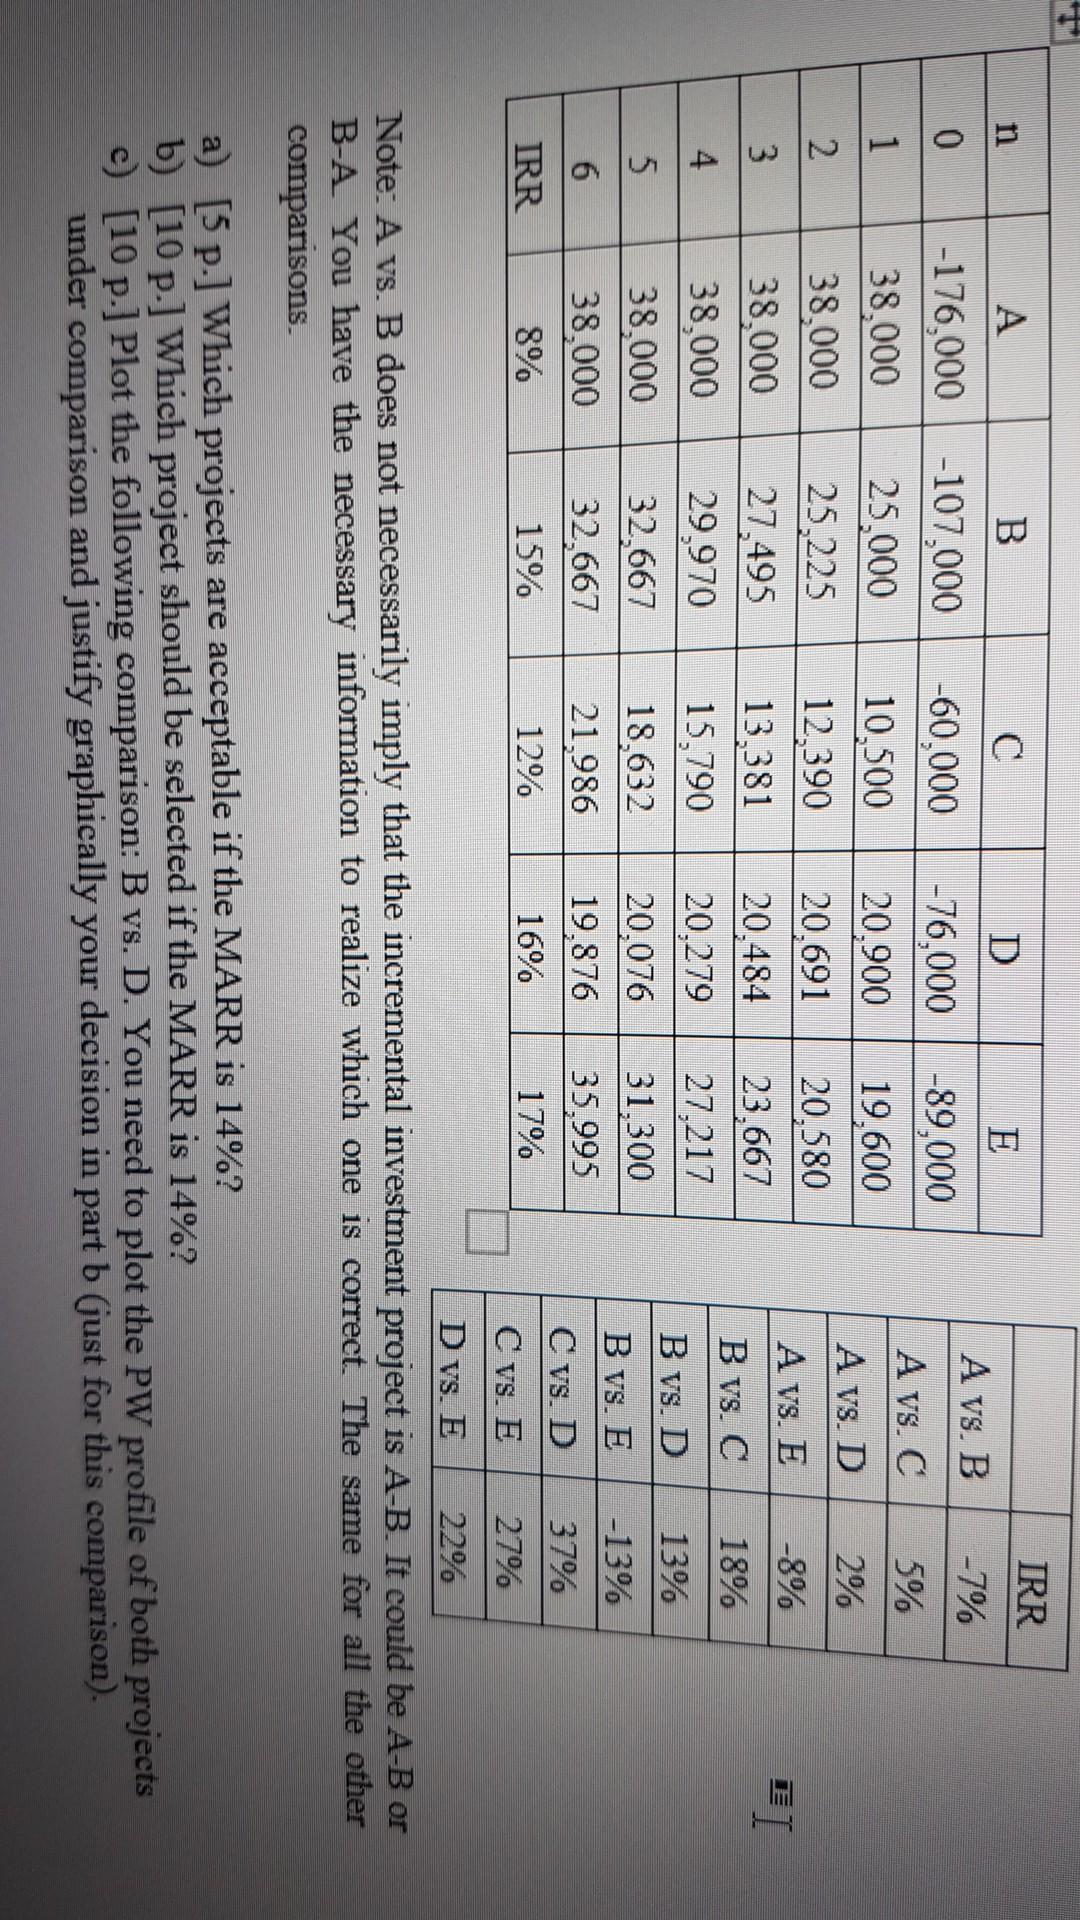
IRR n A B C D E A vs. B -7% 0 -176,000 A VS. C 5% 1 A vs. D 2% 2 A vs. E -8% 3 -107.000 25,000 25.225 27,495 29,970 32,667 32,667 EI -60.000 10,500 12,390 13.381 15,790 18,632 21.986 12% -76,000 20.900 20.691 20,484 20,279 20.076 19,876 16% 38,000 38,000 38.000 38,000 38,000 38.000 8% -89,000 19,600 20.580 23,667 27,217 31.300 35.995 17% B vs. C 18% 4 B vs. D 13% 5 6 B vs. E C vs. D C vs. E -13% 37% 27% IRR 15% Dvs. E 22% Note: A vs. B does not necessarily imply that the incremental investment project is A-B. It could be A-B or B-A You have the necessary information to realize which one is correct. The same for all the other comparisons a) [5 p.] Which projects are acceptable if the MARR is 14%? b) (10 p.) Which project should be selected if the MARR is 14%? c) [10 p.] Plot the following comparison: B vs. D. You need to plot the PW profile of both projects under comparison and justify graphically your decision in part b (just for this comparison)
Step by Step Solution
There are 3 Steps involved in it

Get step-by-step solutions from verified subject matter experts