

Question: Is A) the pie chart correctB) both charts correctC) the bar chart correctD) neither chart correct. Data of Travel Mode for Arizona Workers Data of
Is A) the pie chart correctB) both charts correctC) the bar chart correctD) neither chart correct.
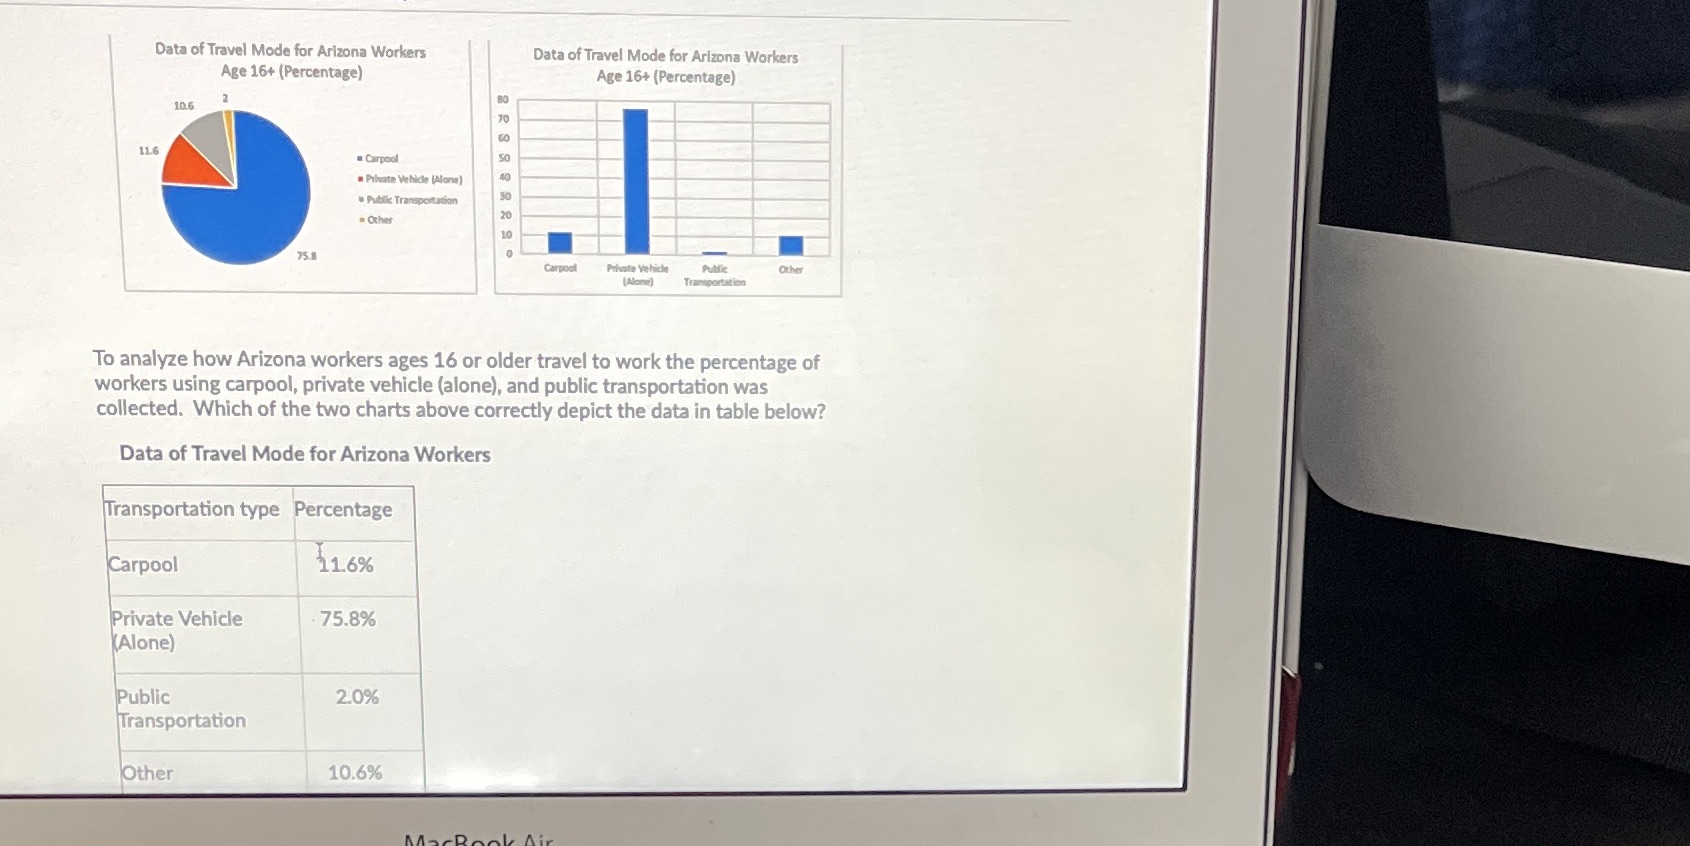
Data of Travel Mode for Arizona Workers Data of Travel Mode for Arizona Workers Age 16+ (Percentage) Age 16+ (Percentage) 10.6 2 11.6 Carpool . Private Vehicle (Alone] Public Transportation Other 75.8 Carpool Private Vehicle Public Other (Alone) Transportation To analyze how Arizona workers ages 16 or older travel to work the percentage of workers using carpool, private vehicle (alone), and public transportation was collected. Which of the two charts above correctly depict the data in table below? Data of Travel Mode for Arizona Workers Transportation type Percentage Carpool 11.6% Private Vehicle 75.8% (Alone) Public 2.0% Transportation Other 10.6%
Step by Step Solution
There are 3 Steps involved in it

Get step-by-step solutions from verified subject matter experts