

Question: is this graph correct? and also could i have help with 3 and 5 Table 2: Equilibrium Constants Data t-Lab Questions Use the graph paper
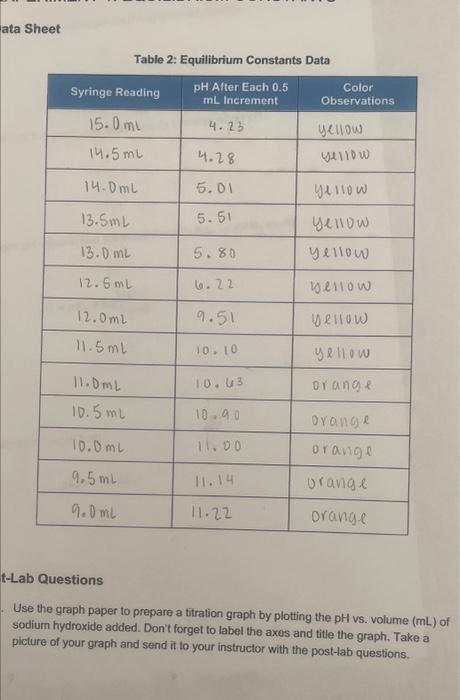
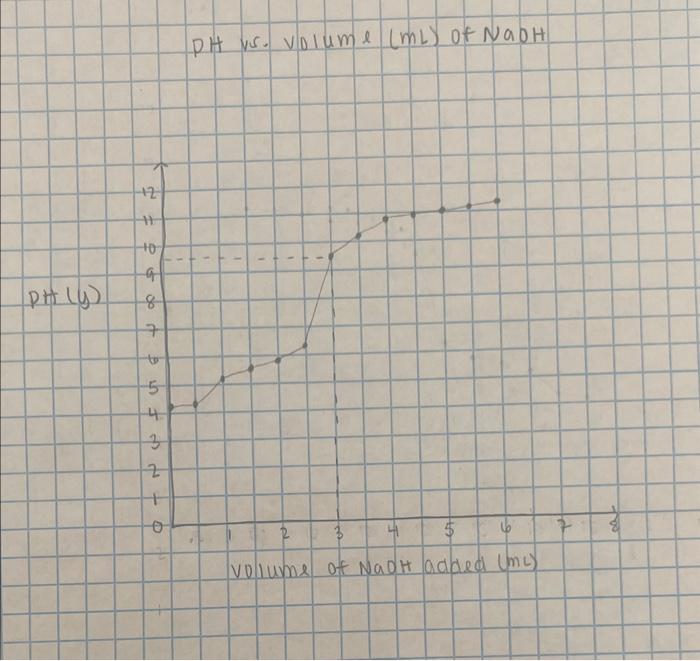
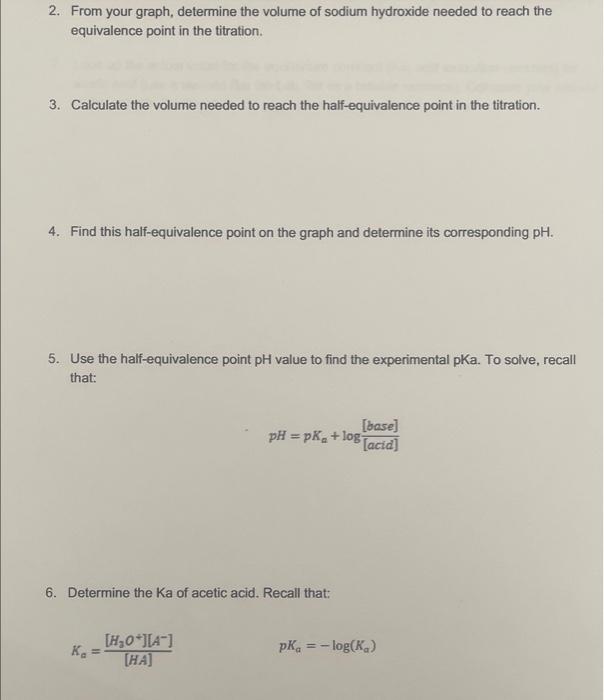
Table 2: Equilibrium Constants Data t-Lab Questions Use the graph paper to prepare a titration graph by plotting the pH vs. volume ( mL) of sodium hydroxide added. Don't forget to label the axes and title the graph. Take a picture of your graph and send it to your instructor with the post-lab questions. PH ws. volume (mL) of NaOH volume of NadH added (mL) 2. From your graph, determine the volume of sodium hydroxide needed to reach the equivalence point in the titration. 3. Calculate the volume needed to reach the half-equivalence point in the titration. 4. Find this half-equivalence point on the graph and determine its corresponding pH. 5. Use the half-equivalence point pH value to find the experimental pKa. To solve, recall that: pH=pKa+log[acid][base] 6. Determine the Ka of acetic acid. Recall that: Ka=[HA][H3O+][A]pKa=log(Ka)
Step by Step Solution
There are 3 Steps involved in it

Get step-by-step solutions from verified subject matter experts