

Question: Post-Lab Questions 1. Use the graph paper to prepare a titration graph by plotting the pH vs. volume (mL) of sodium hydroxide added. Dont forget
Post-Lab Questions
1. Use the graph paper to prepare a titration graph by plotting the pH vs. volume (mL) of sodium hydroxide added. Dont forget to label the axes and title the graph. Take a picture of your graph and send it to your instructor with the post-lab questions.
2. From your graph, determine the volume of sodium hydroxide needed to reach the equivalence point in the titration.
3. Calculate the volume needed to reach the half-equivalence point in the titration.
4. Find this half-equivalence point on the graph and determine its corresponding pH.
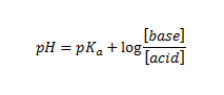
5. Use the half-equivalence point pH value to find the experimental pKa. To solve, recall that:
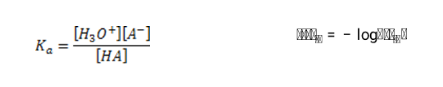
6. Determine the Ka of acetic acid. Recall that:
7. Look up the actual value for the equilibrium constant (Ka; acid ionization constant) for acetic acid (use a website of as a reliable resource). Compare your answer to the value in the literature. Do you notice any variation? If so, why?
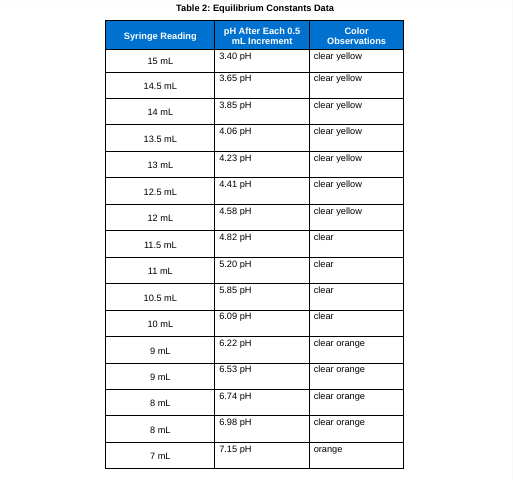
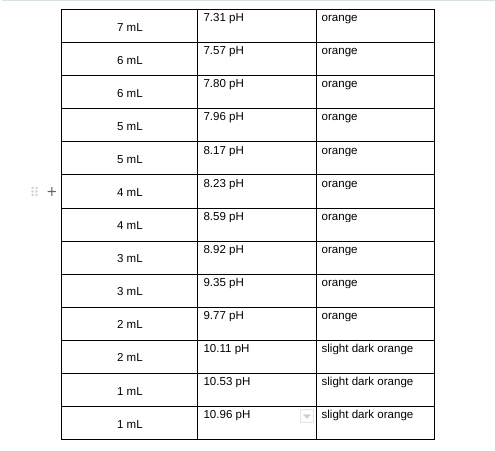
Table 2: Equilibrium Constants Data \begin{tabular}{|c|l|l|} \hline 7mL & 7.31pH & orange \\ \hline 6mL & 7.57pH & orange \\ \hline 6mL & 7.80pH & orange \\ \hline 5mL & 7.96pH & orange \\ \hline 5mL & 8.17pH & orange \\ \hline 4mL & 8.23pH & orange \\ \hline 4mL & 8.59pH & orange \\ \hline 3mL & 10.92pH & orange \\ \hline 3mL & 9.35pH & orange \\ \hline 2mL & mH & slight dark orange \\ \hline 2mL & 10.96pH & \\ \hline & & \\ \hline \end{tabular} pH=pKa+log[acid][base] Ka=[HA][H3O+][A]=logDAB[
Step by Step Solution
There are 3 Steps involved in it

Get step-by-step solutions from verified subject matter experts