

Question: It is out-of-control (abnormal variation) and should be corrected The UCL and lcl are too close together The UCL and LCl are too far apart
 It is out-of-control (abnormal variation) and should be corrected The UCL and lcl are too close together
The UCL and LCl are too far apart
It is in-control (normal variation) and should not be corrected
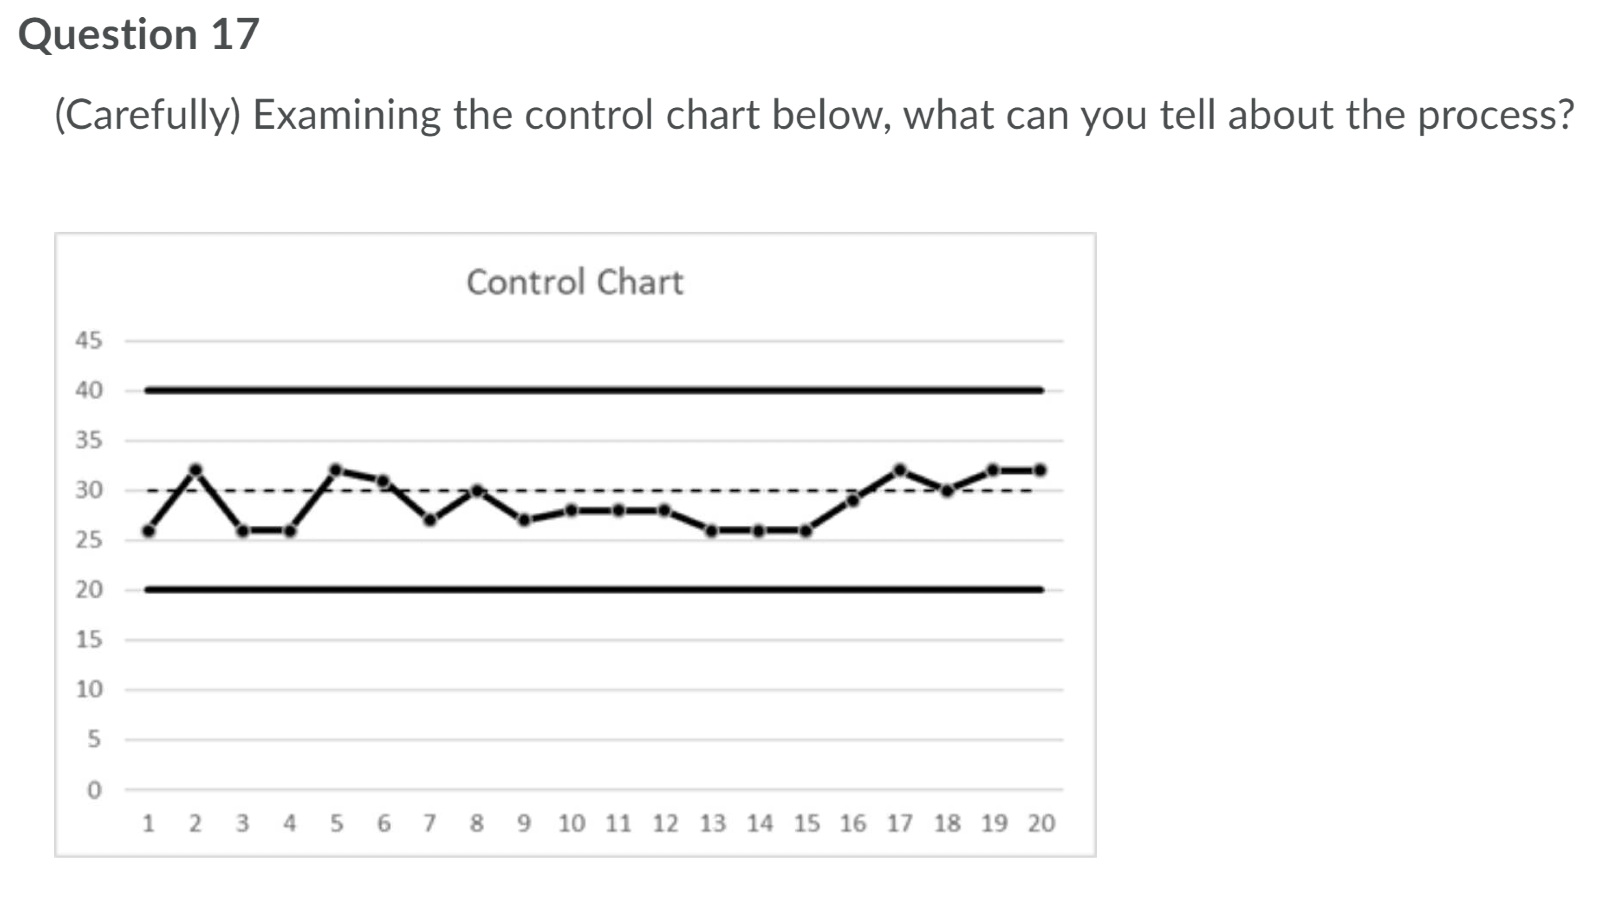
Question 17 (Carefully) Examining the control chart below, what can you tell about the process? Control Chart 45 40 35 30 Ant 25 20 15 10 5 0 1 2 3 4 5 6 7 00 9 10 11 12 13 14 15 16 17 18 19 20Step by Step Solution
There are 3 Steps involved in it
1 Expert Approved Answer
Step: 1 Unlock

Question Has Been Solved by an Expert!
Get step-by-step solutions from verified subject matter experts
Step: 2 Unlock
Step: 3 Unlock