

Question: For K = 10, draw the Bode diagram of the system shown in Fig. P16.9. From the Bode diagram construct the Nyquist diagram, and
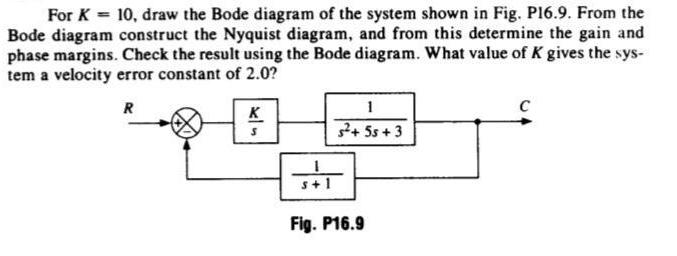
For K = 10, draw the Bode diagram of the system shown in Fig. P16.9. From the Bode diagram construct the Nyquist diagram, and from this determine the gain and phase margins. Check the result using the Bode diagram. What value of K gives the sys- tem a velocity error constant of 2.0? R 1 K + 5s +3 + 1 Fig. P16.9
Step by Step Solution
★★★★★
3.42 Rating (155 Votes )
There are 3 Steps involved in it
1 Expert Approved Answer
Step: 1 Unlock

the solu... View full answer
Question Has Been Solved by an Expert!
Get step-by-step solutions from verified subject matter experts
Step: 2 Unlock
Step: 3 Unlock