

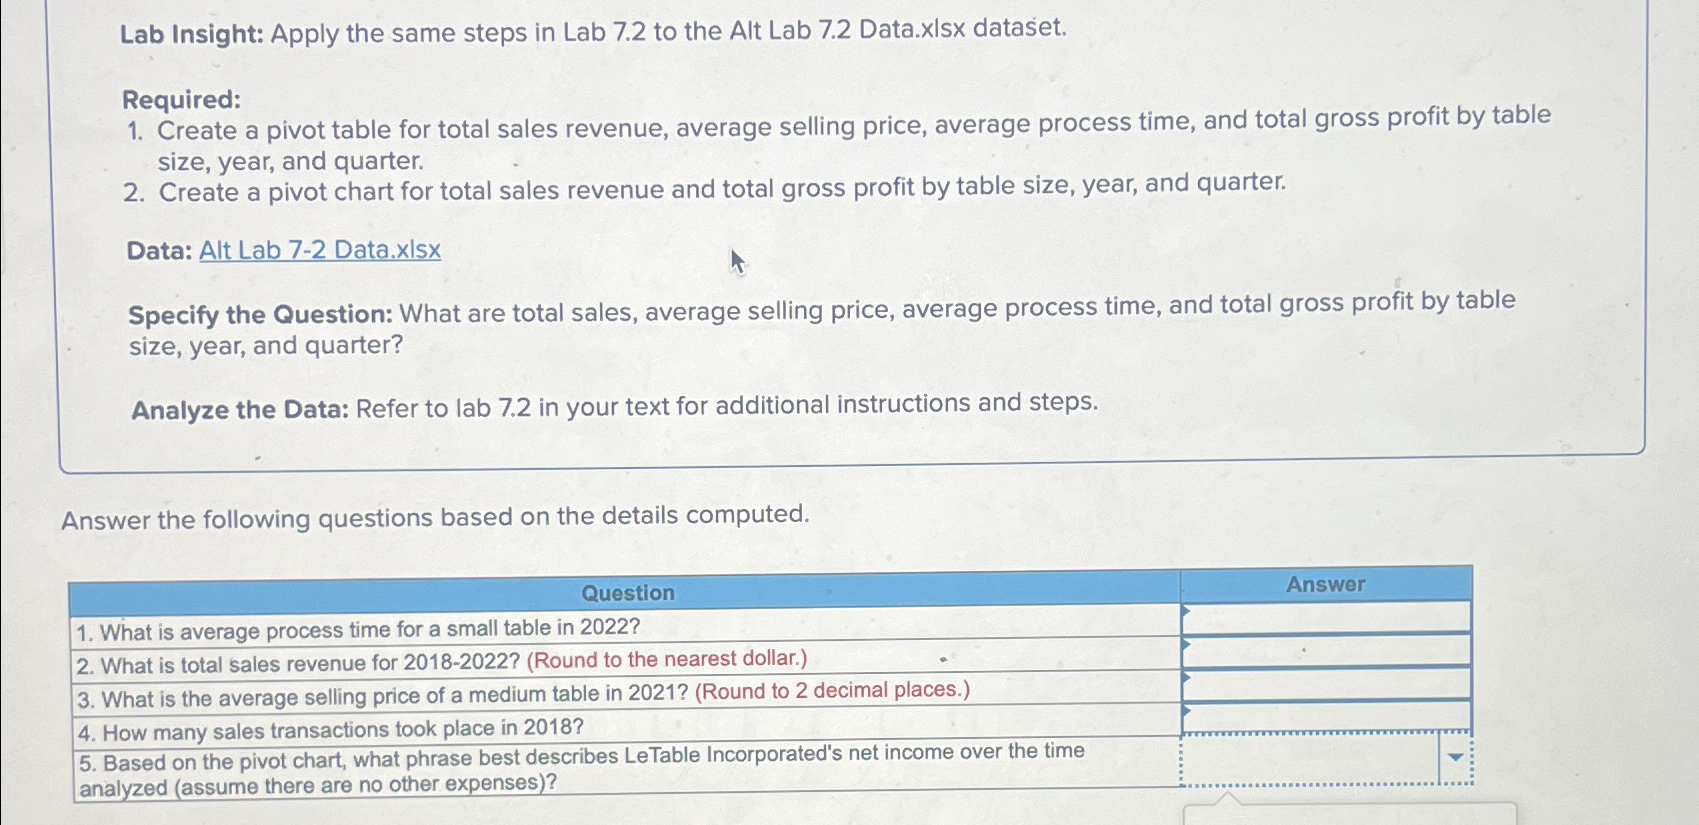
Question: Lab Insight: Apply the same steps in Lab 7 . 2 to the Alt Lab 7 . 2 Data.xlsx dataset. Required: Create a pivot table
Lab Insight: Apply the same steps in Lab to the Alt Lab Data.xlsx dataset.
Required:
Create a pivot table for total sales revenue, average selling price, average process time, and total gross profit by table size, year, and quarter.
Create a pivot chart for total sales revenue and total gross profit by table size, year, and quarter.
Data: Alt Lab Data.xlsx
Specify the Question: What are total sales, average selling price, average process time, and total gross profit by table size, year, and quarter?
Analyze the Data: Refer to lab in your text for additional instructions and steps.
Answer the following questions based on the details computed.
tableQuestionAnswer What is average process time for a small table in What is total sales revenue for Round to the nearest dollar. What is the average selling price of a medium table in Round to decimal places. How many sales transactions took place in table Based on the pivot chart, what phrase best describes LeTable Incorporated's net income over the timeanalyzed assume there are no other expenses
Step by Step Solution
There are 3 Steps involved in it
1 Expert Approved Answer
Step: 1 Unlock

Question Has Been Solved by an Expert!
Get step-by-step solutions from verified subject matter experts
Step: 2 Unlock
Step: 3 Unlock