

Question: Let f be the function whose graph is shown in the following figure. y -2 0 T Figure 1 Let f be the function whose
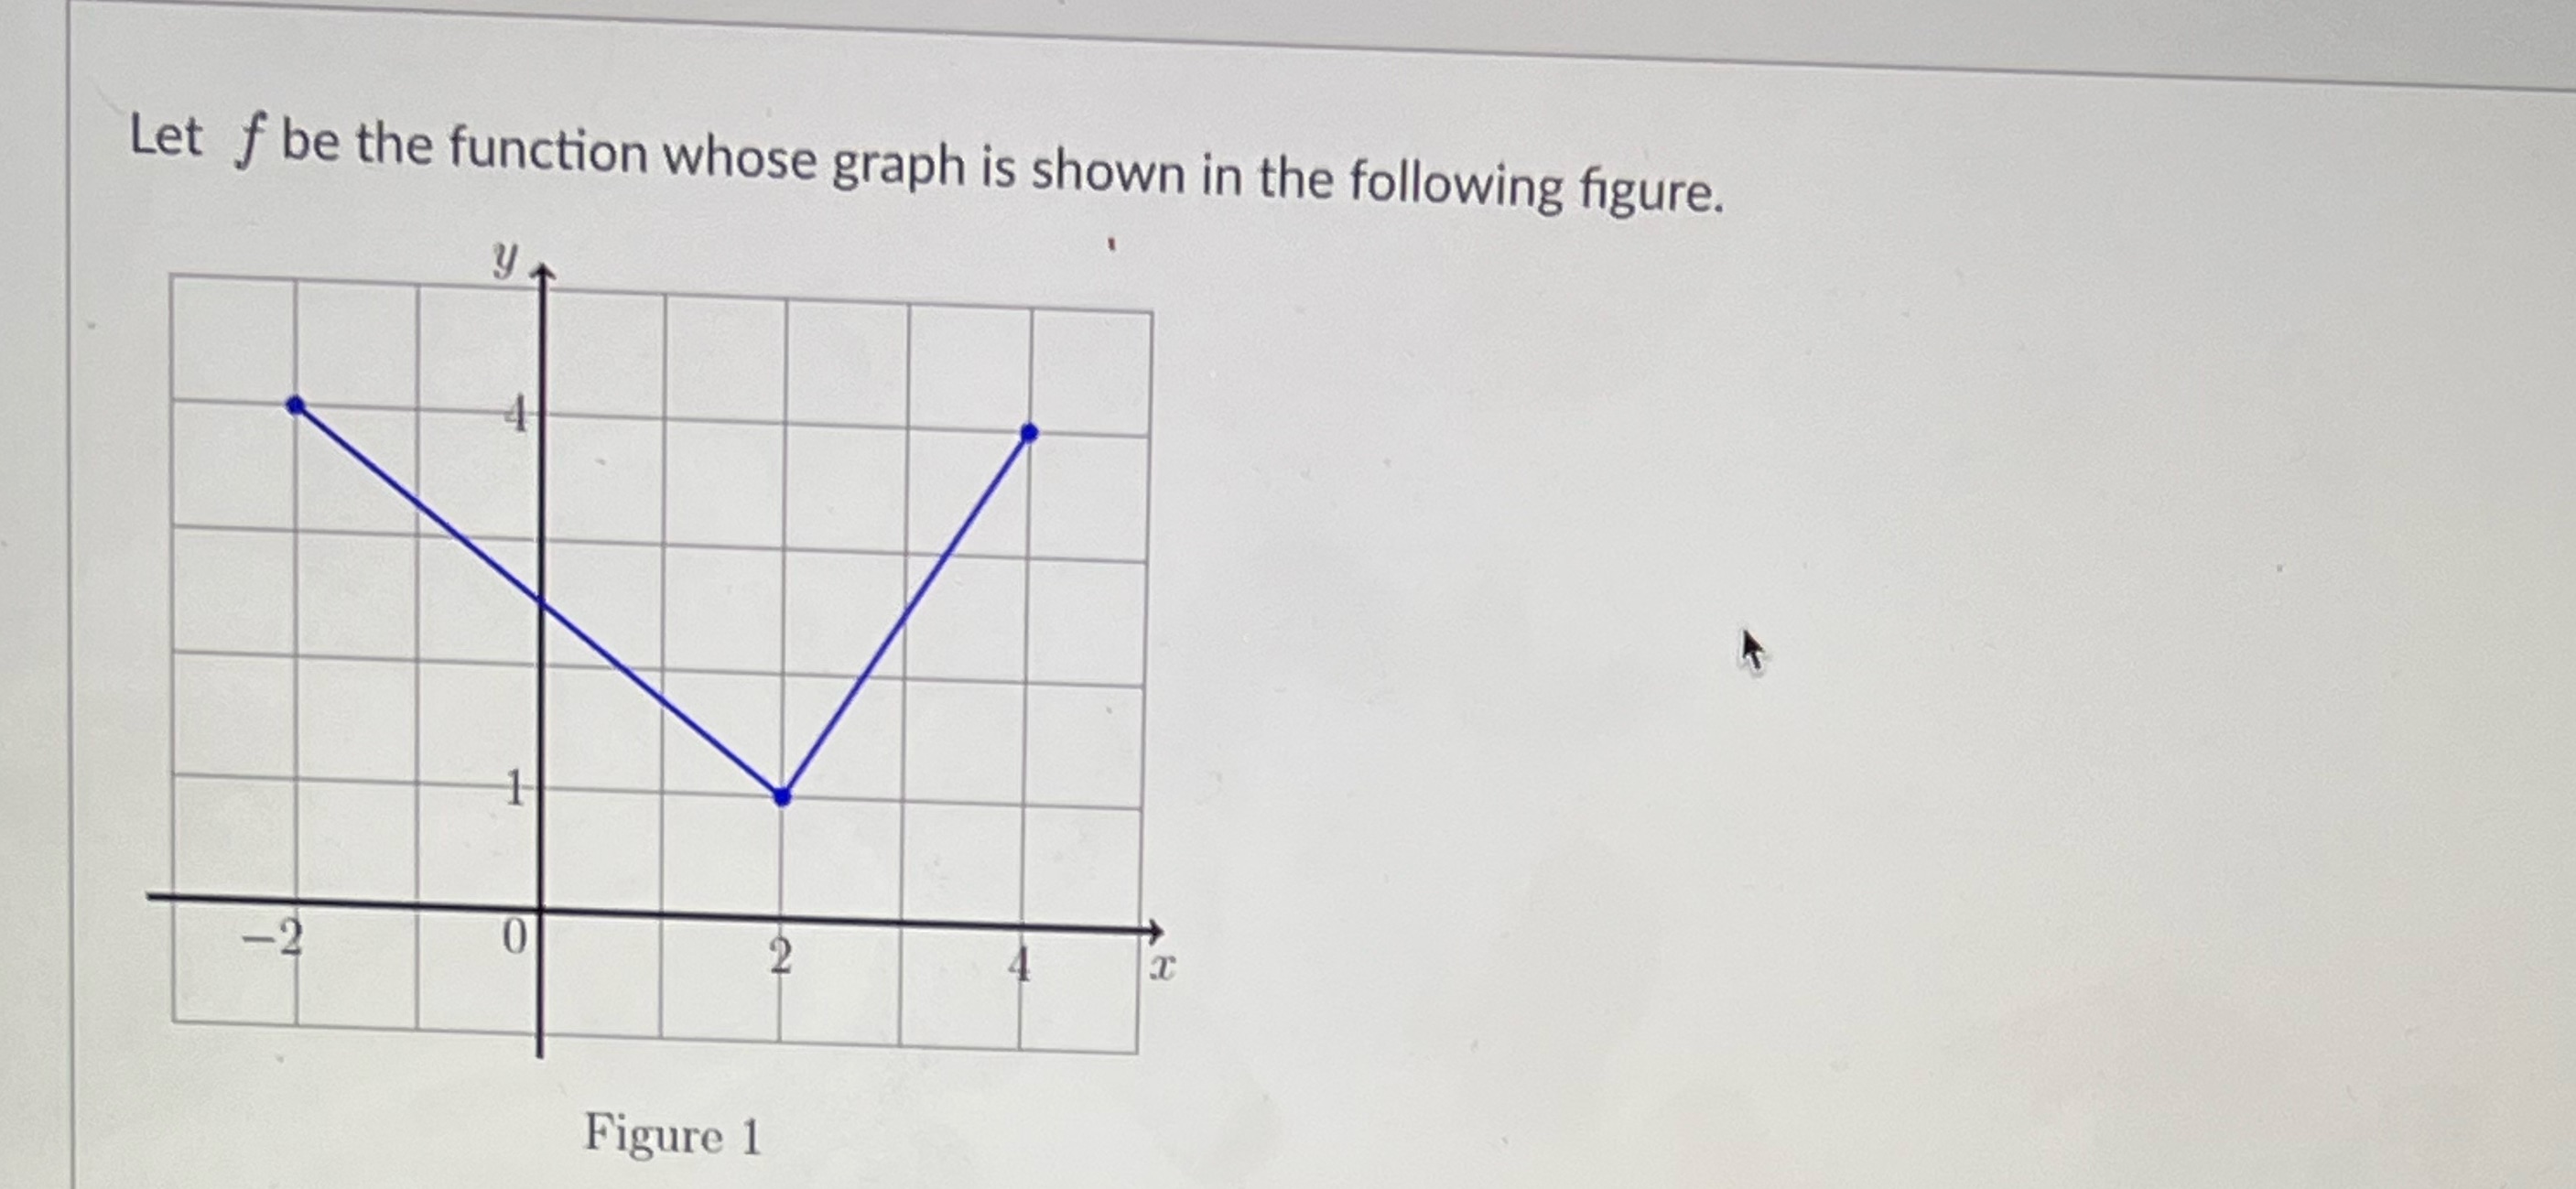
Let f be the function whose graph is shown in the following figure. y -2 0 T Figure 1
Let f be the function whose graph is shown in the following figure. 1 Figure 1
Step by Step Solution
There are 3 Steps involved in it
1 Expert Approved Answer
Step: 1 Unlock

Question Has Been Solved by an Expert!
Get step-by-step solutions from verified subject matter experts
Step: 2 Unlock
Step: 3 Unlock