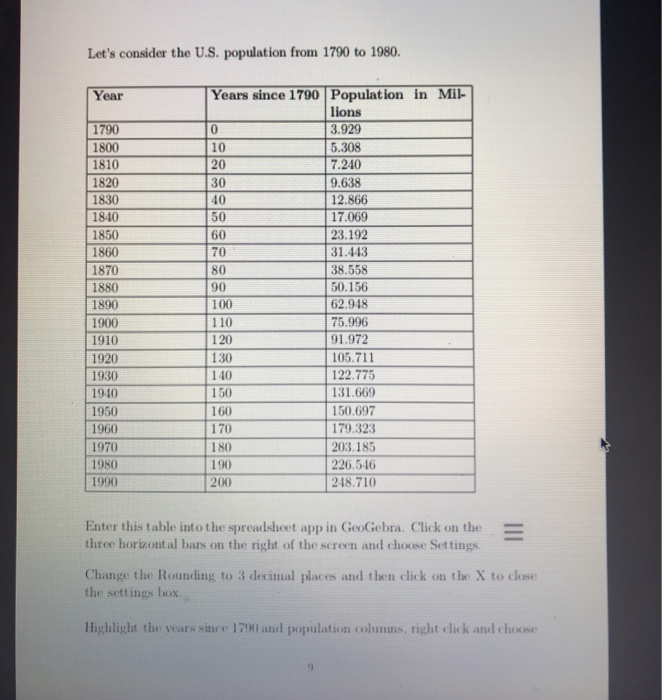
Question: Let's consider the U.S. population from 1790 to 1980. Year 1790 1800 1810 1820 1830 1840 1850 1860 1870 1880 1890 1900 1910 1920 1930

Let's consider the U.S. population from 1790 to
Let's consider the U.S. population from 1790 to 1980. Year 1790 1800 1810 1820 1830 1840 1850 1860 1870 1880 1890 1900 1910 1920 1930 1940 1950 1960 1970 1980 1990 Years since 1790 Population in Mil- lions 3.929 5.308 7.240 9.638 12.866 17.069 23.192 31.443 38.558 50.156 62.948 75.996 91.972 105.711 122.775 131.669 150.697 179.323 INO 203.185 190 226.516 248.710 200 Enter this table into the spreadsheet app in GeoGebra. Click on the three horizontal bars on the right of the screen and choose Settings Change the Rounding to 3 decimal places and then click on the X to close the settings box Highlight the years since 1790 and population columns, right click and choose Create> List of Points. You will have to zoom in and out to see the points. Highlight the same two columns, and then click on the Analysis button and choose Two Variable Regression Analysis. The choice of model is at the bottom of the screen: choose logistic. For number 2 of EXERCISE SET 6 below, you will need the button the right. EXERCISE SET 6: Type your answers to the questions below. 1. Write down the logistic function. P(1) - 2. Close the Regression Model window by clicking on the button mentioned above and choosing close. Change to the graphing perspective and type in the logistic function you answered with above. Zoom out. Where does the population level out? Answer: 3. In what year does the population seem to level out? Answer: 4. The population of Sweden for 1800 to 1920 can be modeled by the func 4.8597 P( 1.0507675560 where I is the years since 1800 and P is in millions. Use algebra rewrite this function in logistic form P() -1.555+ Let's consider the U.S. population from 1790 to 1980. Year 1790 1800 1810 1820 1830 1840 1850 1860 1870 1880 1890 1900 1910 1920 1930 1940 1950 1960 1970 1980 1990 Years since 1790 Population in Mil- lions 3.929 5.308 7.240 9.638 12.866 17.069 23.192 31.443 38.558 50.156 62.948 75.996 91.972 105.711 122.775 131.669 150.697 179.323 INO 203.185 190 226.516 248.710 200 Enter this table into the spreadsheet app in GeoGebra. Click on the three horizontal bars on the right of the screen and choose Settings Change the Rounding to 3 decimal places and then click on the X to close the settings box Highlight the years since 1790 and population columns, right click and choose Create> List of Points. You will have to zoom in and out to see the points. Highlight the same two columns, and then click on the Analysis button and choose Two Variable Regression Analysis. The choice of model is at the bottom of the screen: choose logistic. For number 2 of EXERCISE SET 6 below, you will need the button the right. EXERCISE SET 6: Type your answers to the questions below. 1. Write down the logistic function. P(1) - 2. Close the Regression Model window by clicking on the button mentioned above and choosing close. Change to the graphing perspective and type in the logistic function you answered with above. Zoom out. Where does the population level out? Answer: 3. In what year does the population seem to level out? Answer: 4. The population of Sweden for 1800 to 1920 can be modeled by the func 4.8597 P( 1.0507675560 where I is the years since 1800 and P is in millions. Use algebra rewrite this function in logistic form P() -1.555+

Step by Step Solution

There are 3 Steps involved in it

1 Expert Approved Answer
Step: 1 Unlock blur-text-image
Question Has Been Solved by an Expert!

Get step-by-step solutions from verified subject matter experts

Step: 2 Unlock
Step: 3 Unlock

Students Have Also Explored These Related General Management Questions!