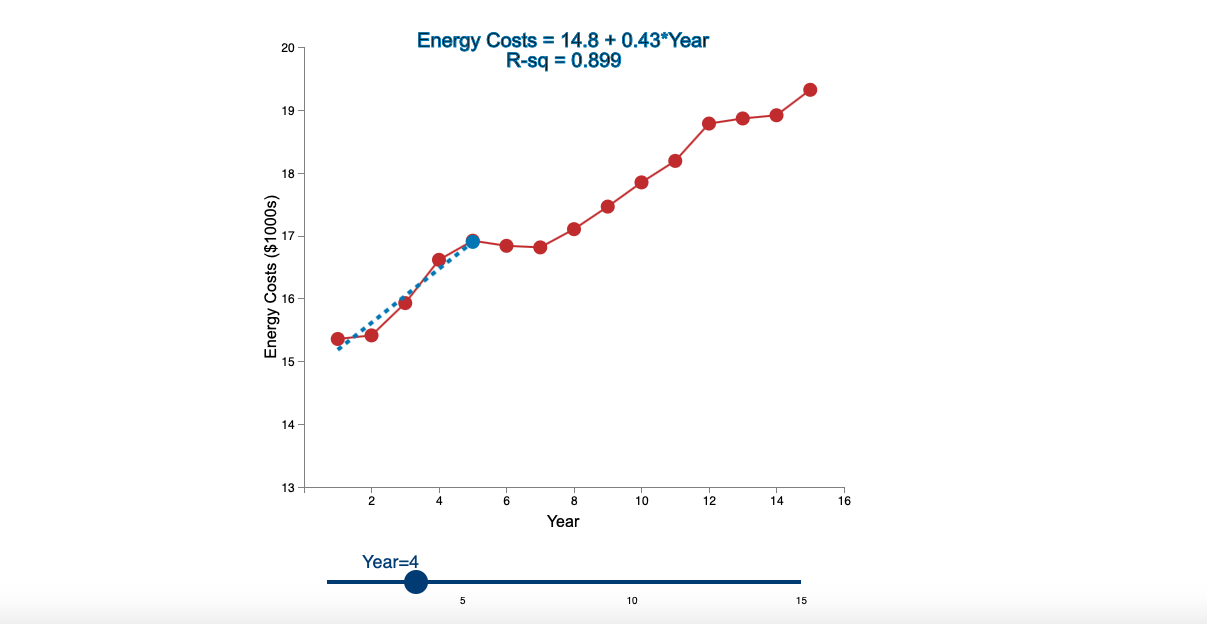
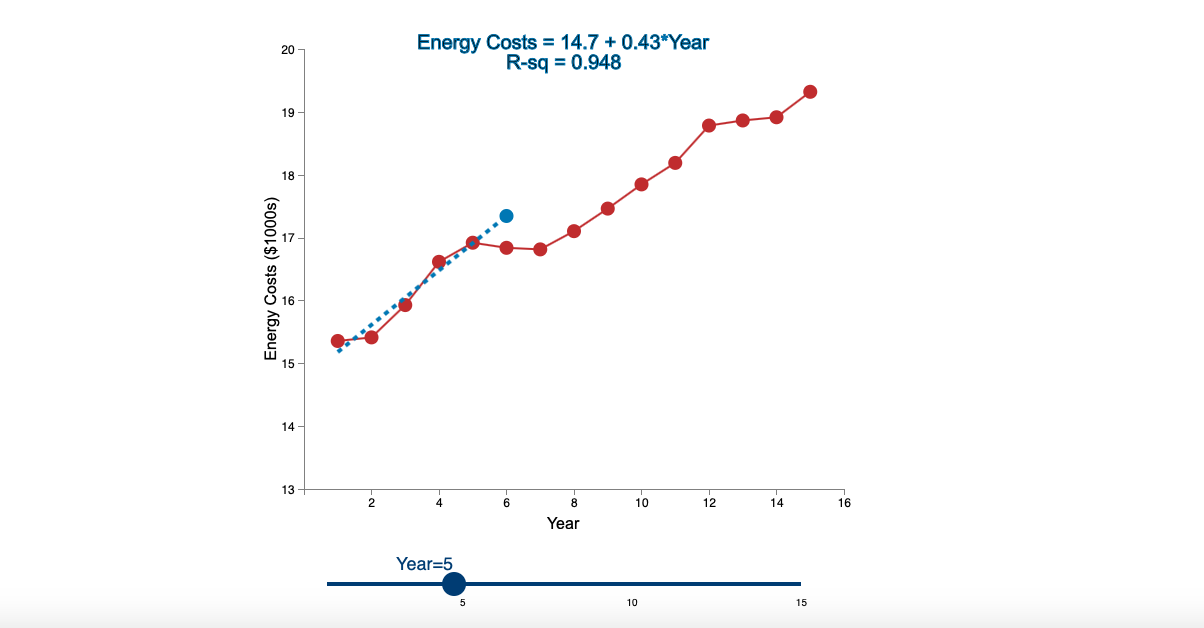
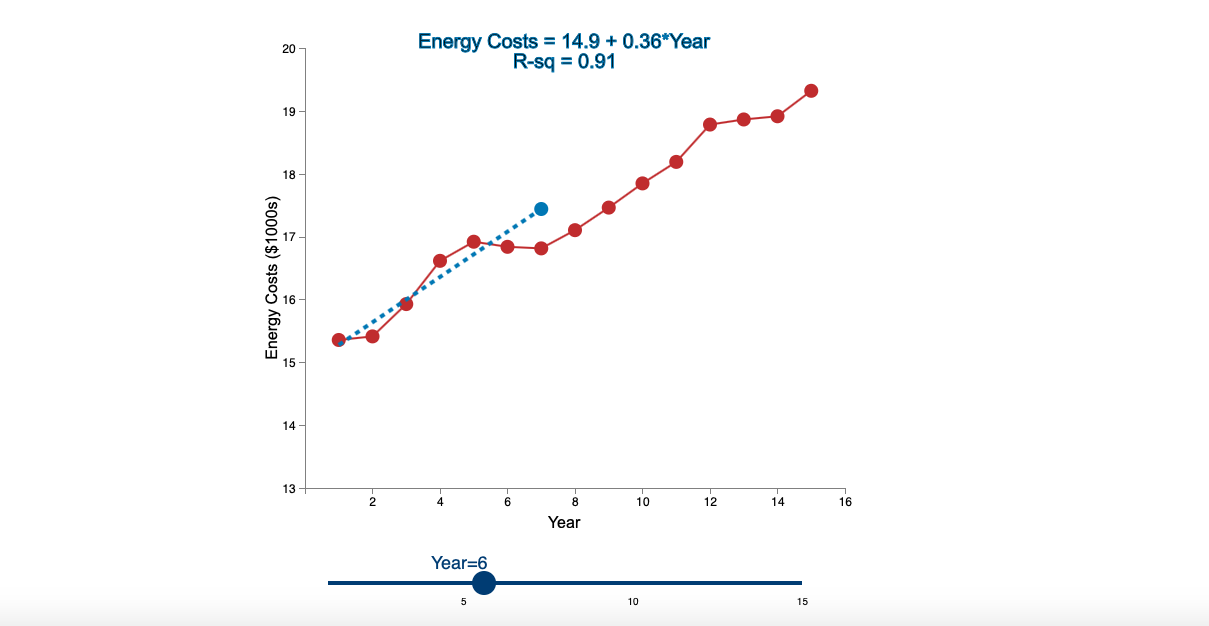
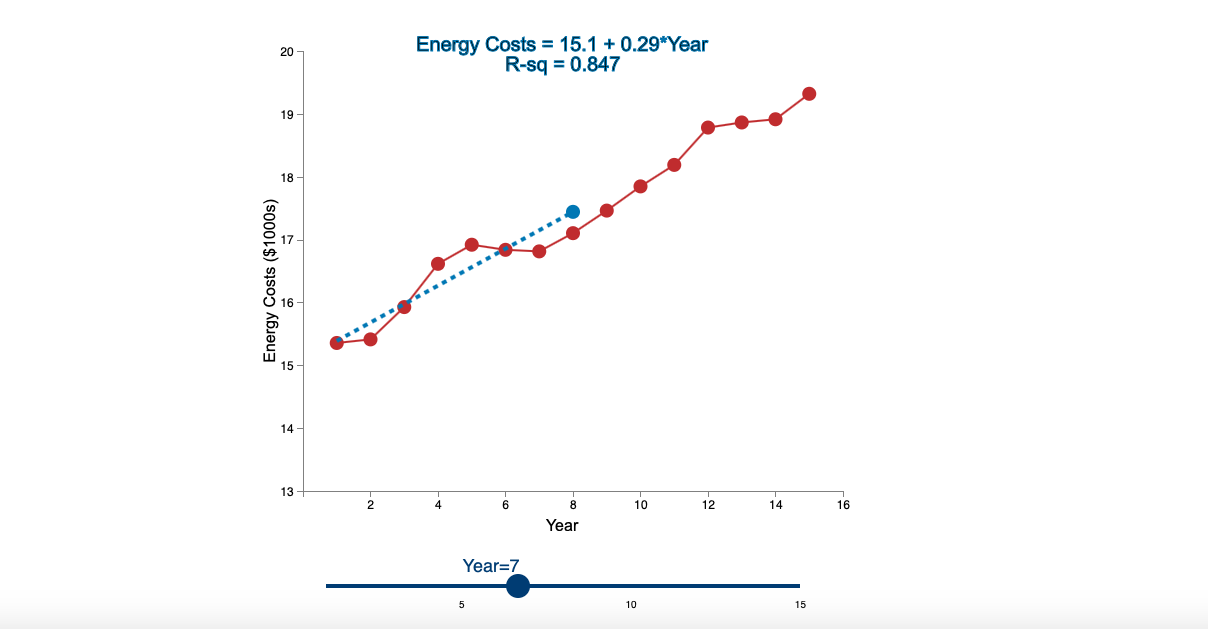
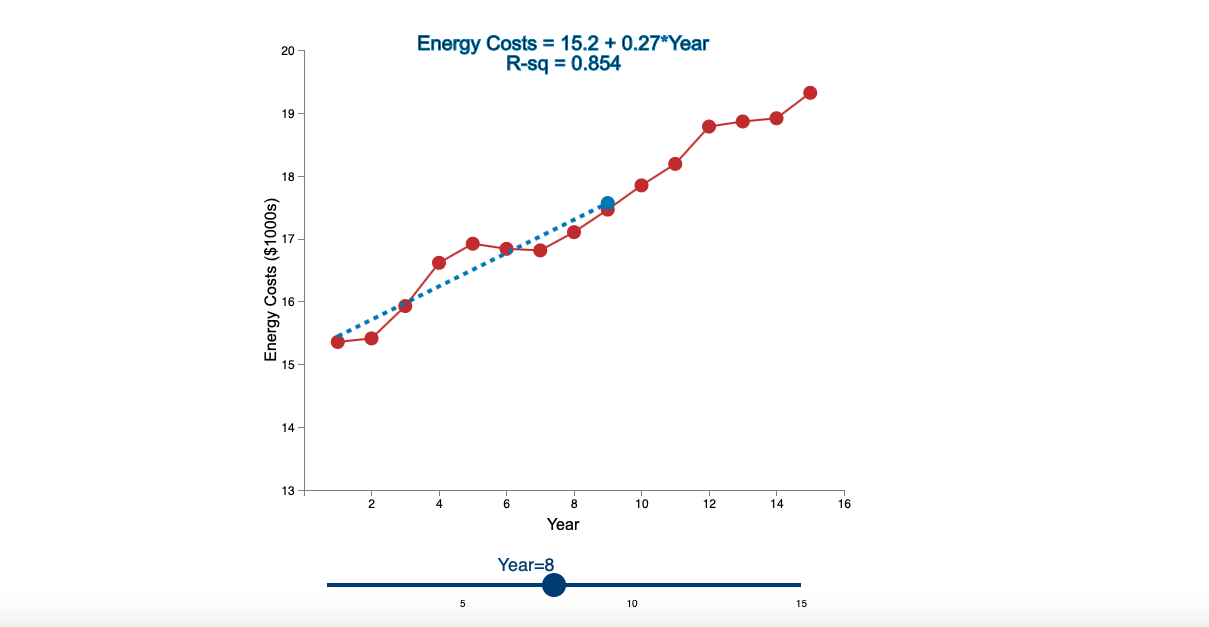
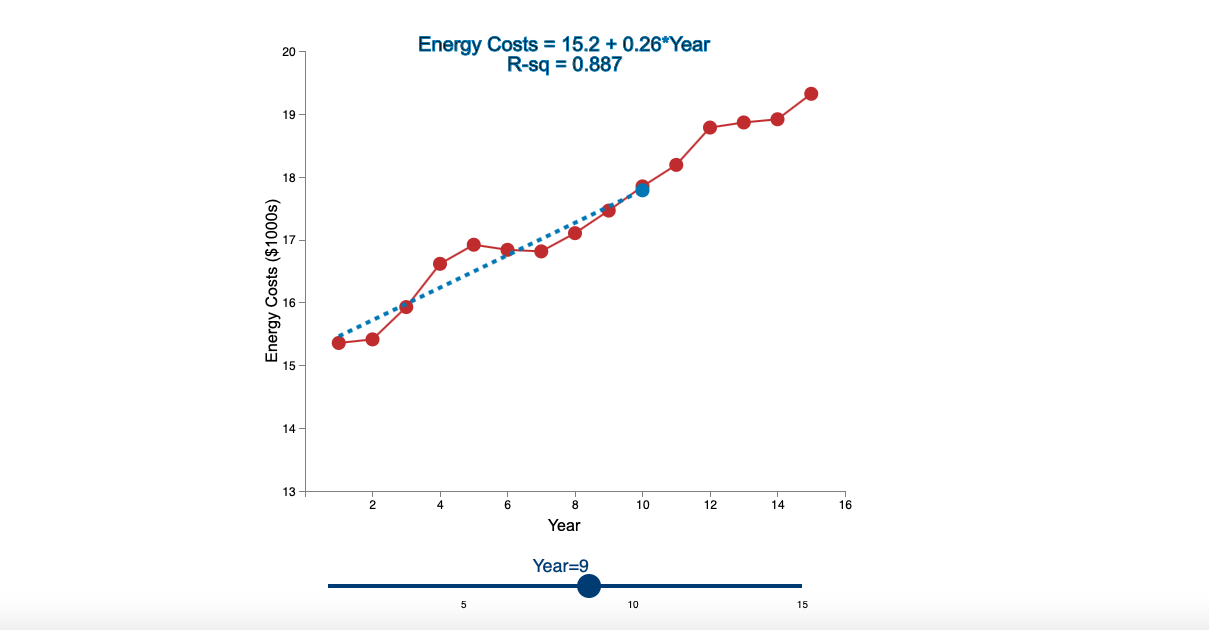
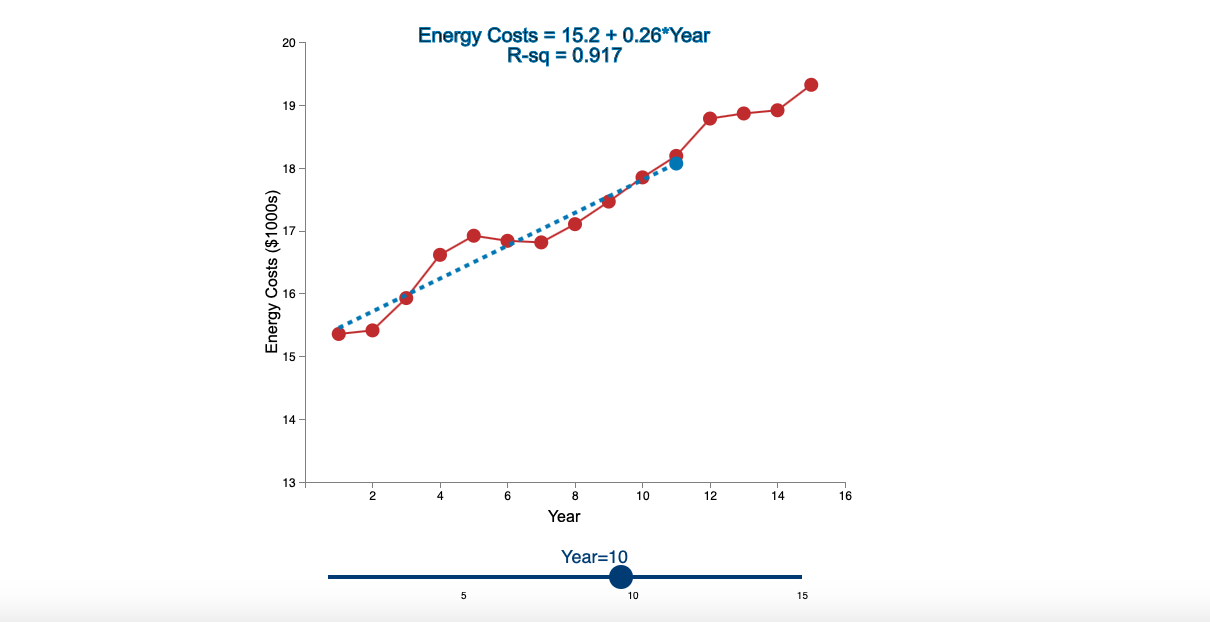
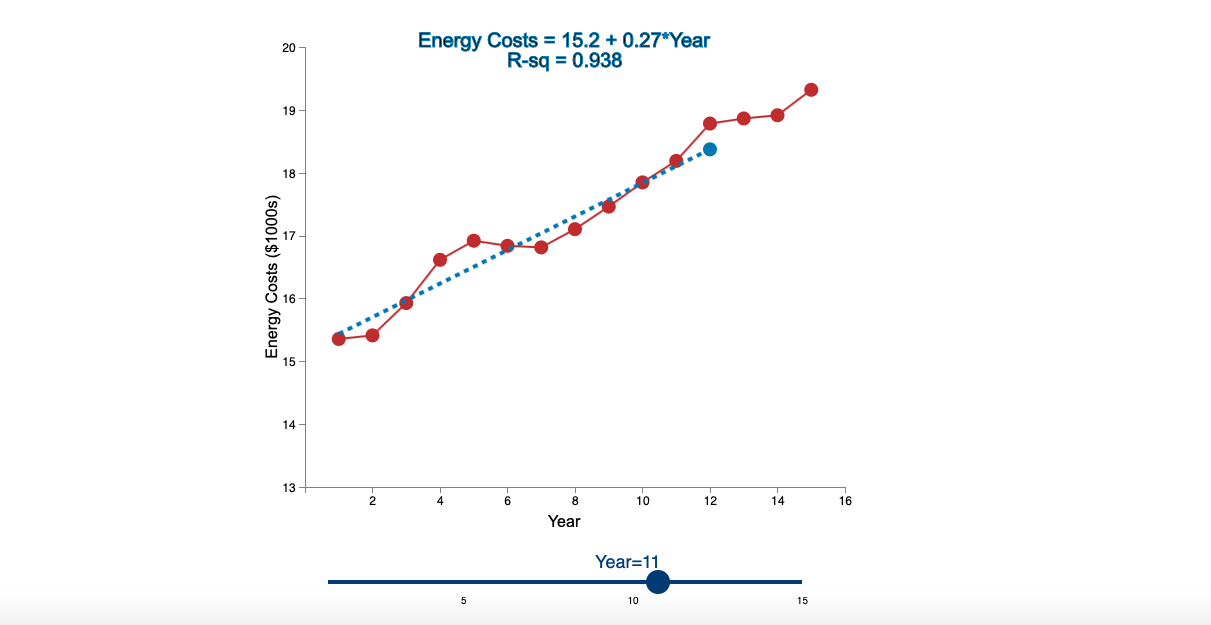
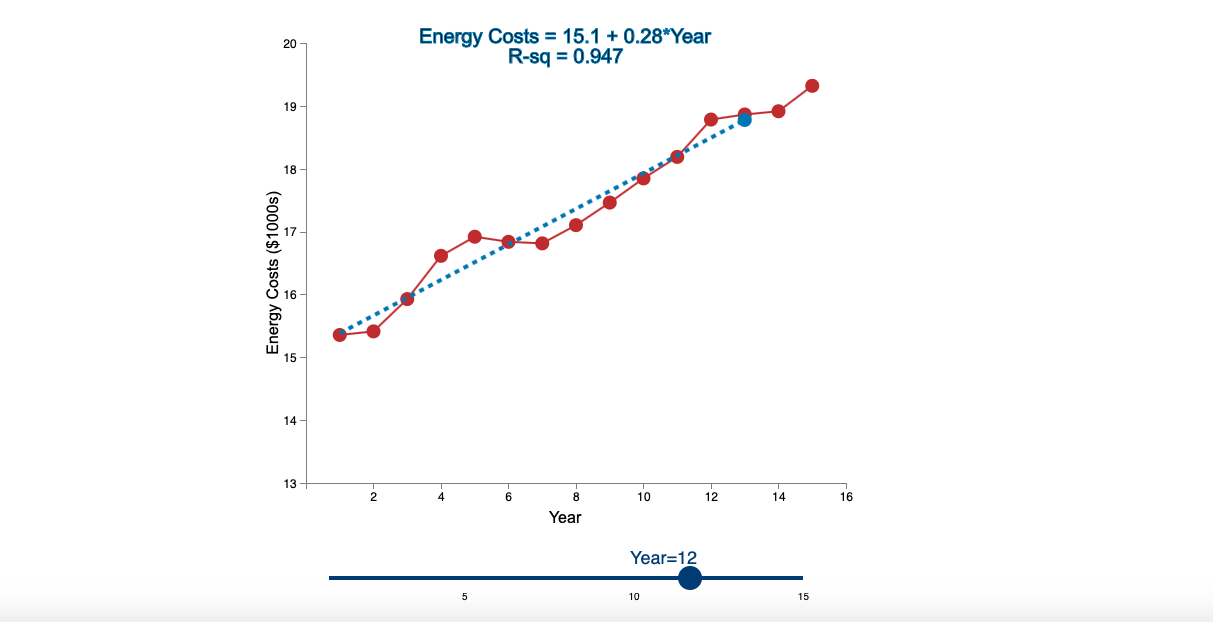
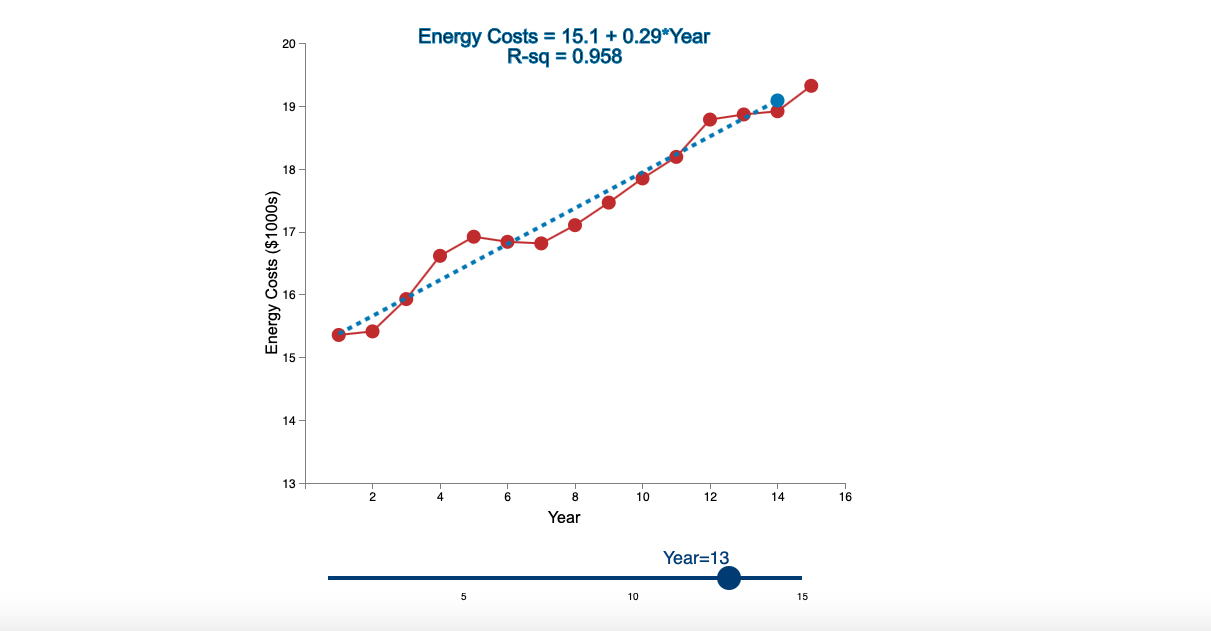
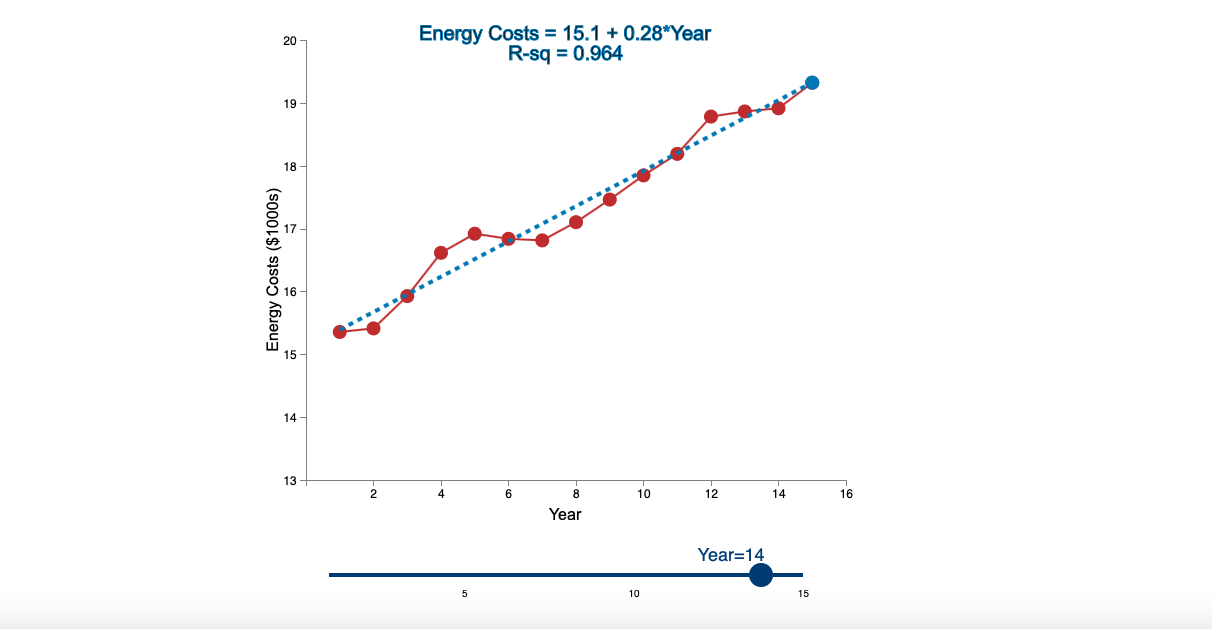
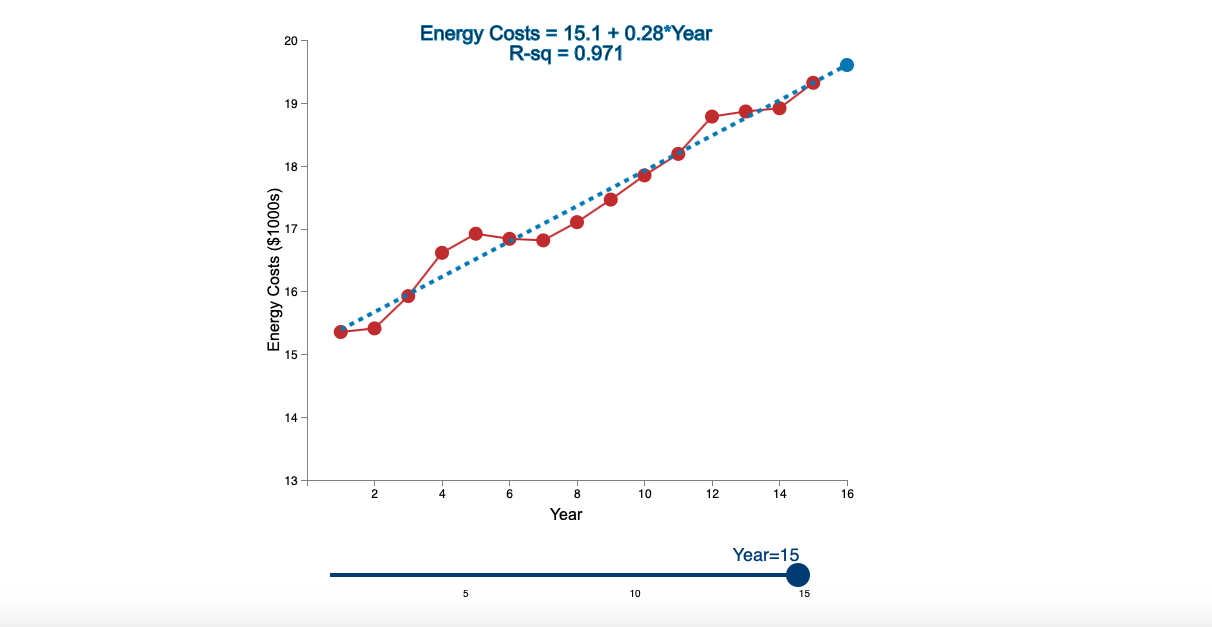
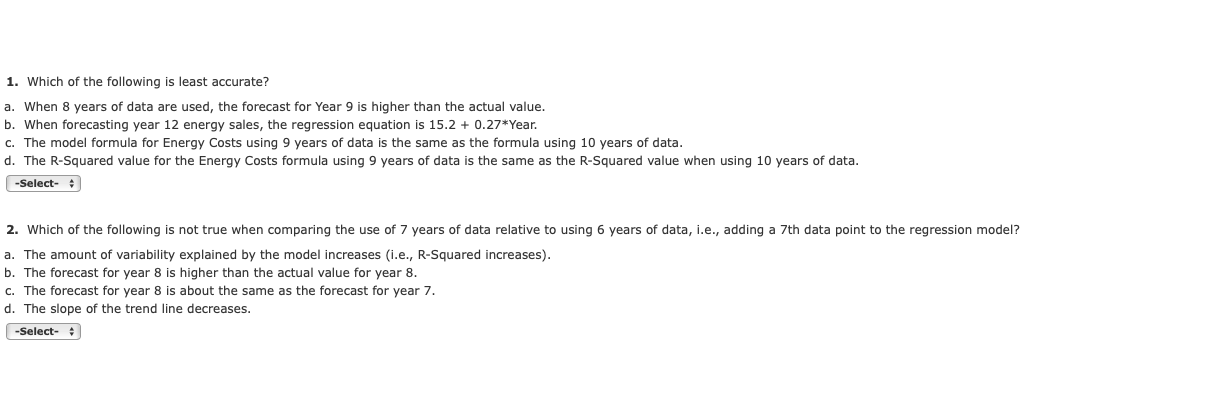
Question: Linear Trend Conceptual Overview: Explore how a linear trend across time provides a forecast for future data points. For two or more time series points,

Linear Trend Conceptual Overview: Explore how aLinear Trend Conceptual Overview: Explore how aLinear Trend Conceptual Overview: Explore how aLinear Trend Conceptual Overview: Explore how aLinear Trend Conceptual Overview: Explore how aLinear Trend Conceptual Overview: Explore how aLinear Trend Conceptual Overview: Explore how aLinear Trend Conceptual Overview: Explore how aLinear Trend Conceptual Overview: Explore how aLinear Trend Conceptual Overview: Explore how aLinear Trend Conceptual Overview: Explore how aLinear Trend Conceptual Overview: Explore how aLinear Trend Conceptual Overview: Explore how aLinear Trend Conceptual Overview: Explore how aLinear Trend Conceptual Overview: Explore how aLinear Trend Conceptual Overview: Explore how aLinear Trend Conceptual Overview: Explore how a

Linear Trend Conceptual Overview: Explore how a linear trend across time provides a forecast for future data points. For two or more time series points, we can fit a regression line to provide an estimate of the next observations. In the graph below, the red dots and the solid red line show the time series data. When first loaded, the blue dot and blue dashed line provide the prediction for Year 2 based entirely on the Year 1 observation. As you use the slider to increase the year, the available observations to that point are used to construct a regression line. The prediction is the next point on the line beyond the current year. As you move the slider note that when there are few time points in the early years, the line jumps around a lot. Eventually the line becomes more stable as more time points are added to predict the linear trend. Energy Costs = 15.4 + 0*Year R-sq = 1 Energy Costs ($1000s) 13+ 4 6 5 Year 10 12 14 16 Year=1 Energy Costs = 15.3 +0.06*Year R-sq = 1 (soo is) sisoj klauz 4 6 $ Year 10 12 14 16 Year=2 Energy Costs = 15 +0.29*Year R-sq = 0.824 Energy Costs ($1000s) 1 4 6 10 12 14 16 8 Year Year=3 Energy Costs = 14.8 +0.43"Year R-sq = 0.899 Energy Costs ($1000s) R 10 12 14 16 8 Year Year=4 Energy Costs = 14.7 +0.43*Year R-sq = 0.948 Energy Costs ($1000s) R 10 12 14 16 Year Year=5 10 Energy Costs = 14.9+0.36*Year R-sq = 0.91 Energy Costs ($1000s) 2 4 6 10 12 14 16 8 Year Year=6 10 Energy Costs = 15.1 +0.29*Year R-sq = 0.847 Energy Costs ($1000s) 2 4 6 8 Year 10 12 14 16 Year=7 Energy Costs = 15.2 + 0.27*Year R-sq = 0.854 Energy Costs ($1000s) 4 6 Year 10 12 14 16 Year=8 Energy Costs = 15.2 +0.26*Year R-sq = 0.887 Energy Costs ($1000) 4 6 5 Year 10 12 14 16 Year=9 10 Energy Costs = 15.2 +0.26*Year R-sq = 0.917 Energy Costs ($1000s) 6 Year 10 12 14 16 Year=10 Year=ie Energy Costs = 15.2 + 0.27*Year R-sq = 0.938 Energy Costs ($1000s) 1. o 12 14 16 Year Year=11 Energy Costs = 15.1 +0.28*Year R-sq = 0.947 . . . . Energy Costs ($1000s) ERO 4 6 5 Year 10 12 14 16 Year=12 Energy Costs = 15.1 +0.29*Year R-sq = 0.958 Energy Costs ($1000s) 2 4 6 8 10 12 14 16 Year Year=13 Energy Costs = 15.1 +0.28*Year R-sq = 0.964 Energy Costs ($1000s) 4 6 10 12 14 16 Year Year=14 Energy Costs = 15.1 + 0.28*Year R-sq = 0.971 (soois) siso Kbsaus Energy Costs ($1000s) W12 4 6 10 12 14 8 Year 16 Year=15 1. Which of the following is least accurate? a. When 8 years of data are used, the forecast for Year 9 is higher than the actual value. b. When forecasting year 12 energy sales, the regression equation is 15.2 + 0.27*Year. C. The model formula for Energy Costs using 9 years of data is the same as the formula using 10 years of data. d. The R-Squared value for the Energy Costs formula using 9 years of data is the same as the R-Squared value when using 10 years of data. -Select- 2. Which of the following is not true when comparing the use of 7 years of data relative to using 6 years of data, i.e., adding a 7th data point to the regression model? a. The amount of variability explained by the model increases i.e., R-Squared increases). b. The forecast for year 8 is higher than the actual value for year 8. C. The forecast for year 8 is about the same as the forecast for year 7. d. The slope of the trend line decreases. -Select

Step by Step Solution

There are 3 Steps involved in it

1 Expert Approved Answer
Step: 1 Unlock blur-text-image
Question Has Been Solved by an Expert!

Get step-by-step solutions from verified subject matter experts

Step: 2 Unlock
Step: 3 Unlock

Students Have Also Explored These Related General Management Questions!