Question: Linear Trend Conceptual Overview: Explore how the linear trend across time provides a forecast. For two or more time series points, we can fit a
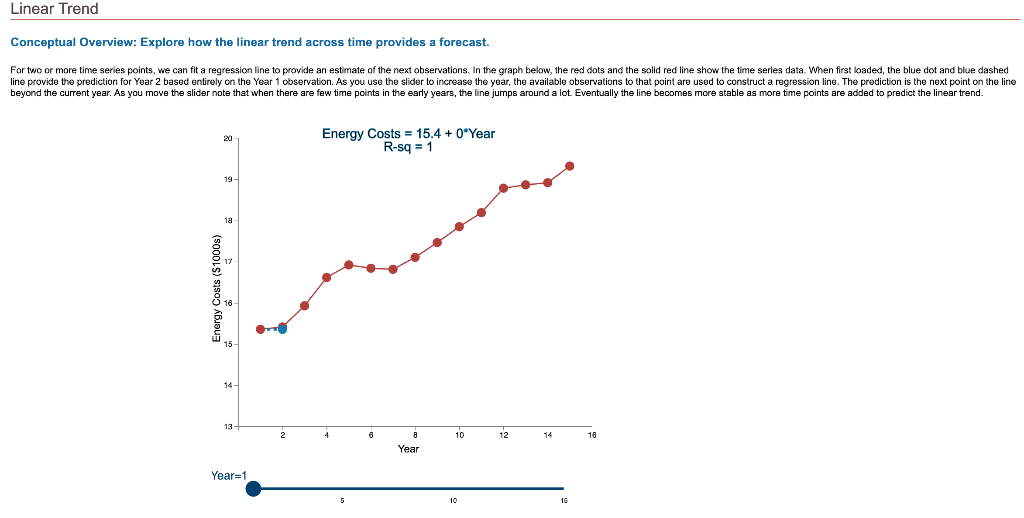
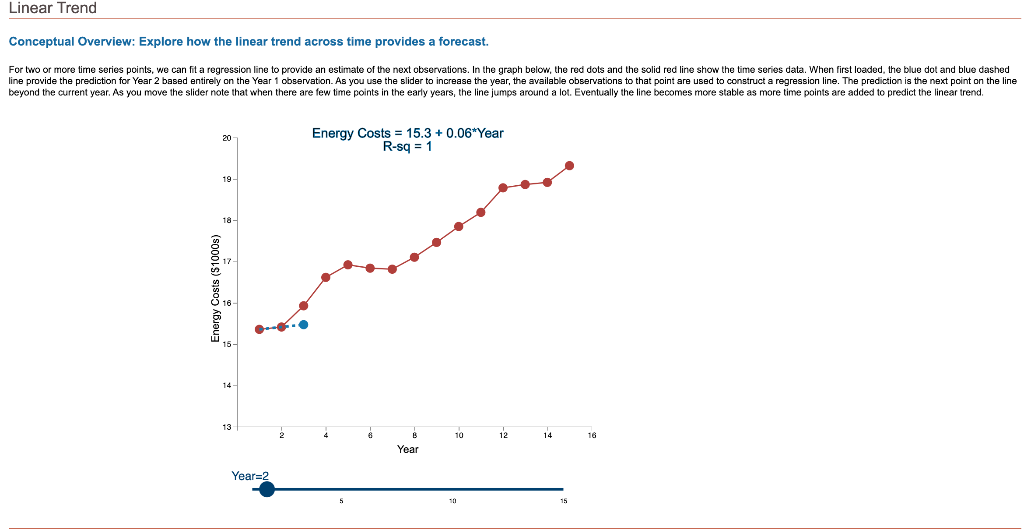
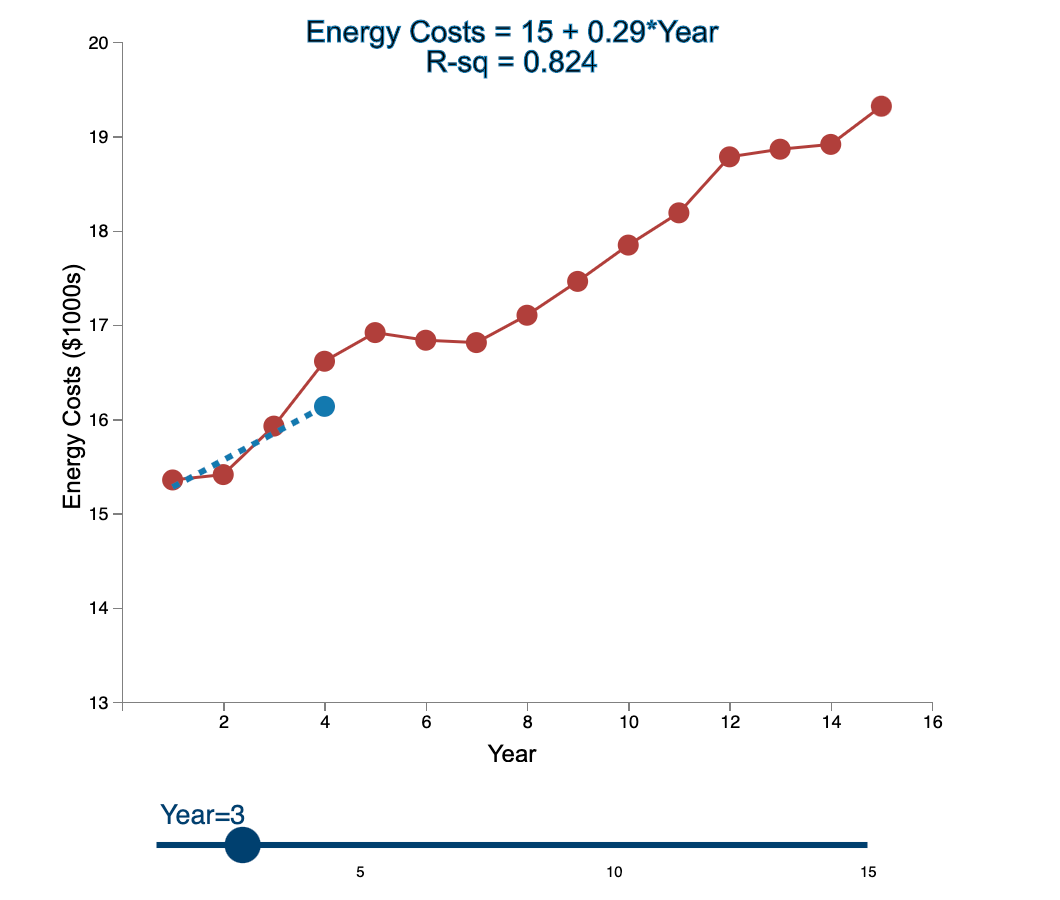
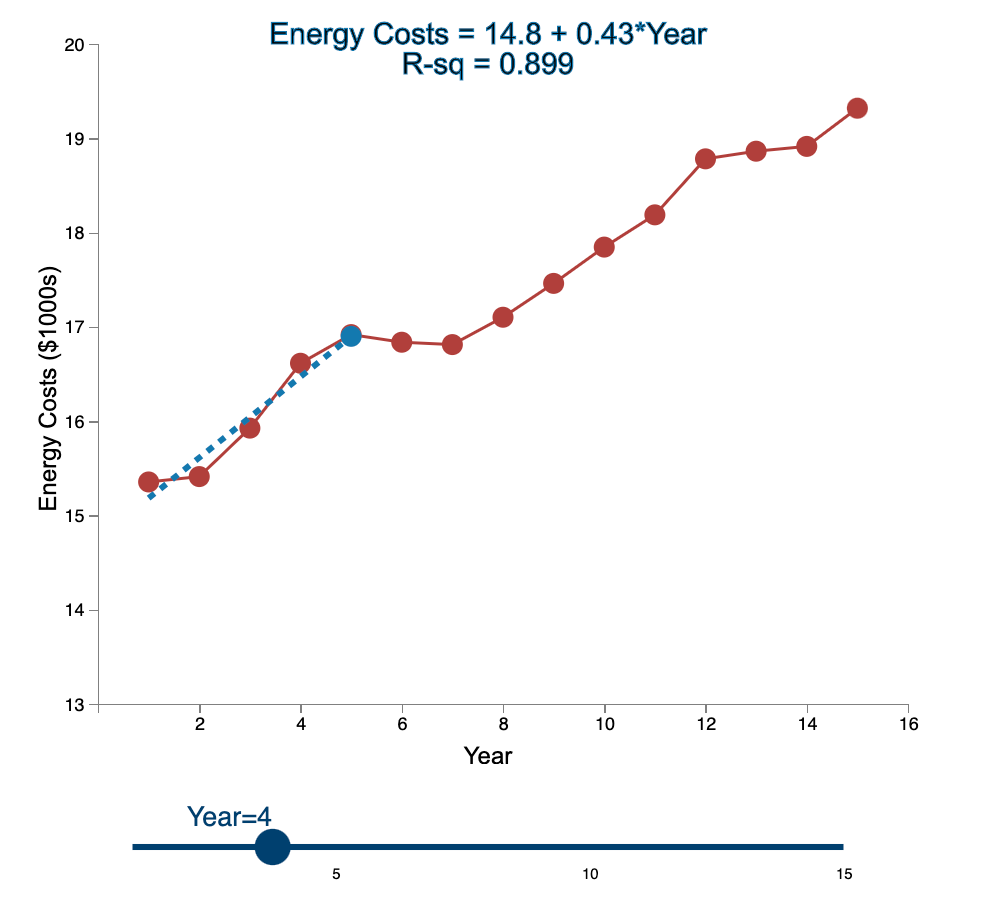
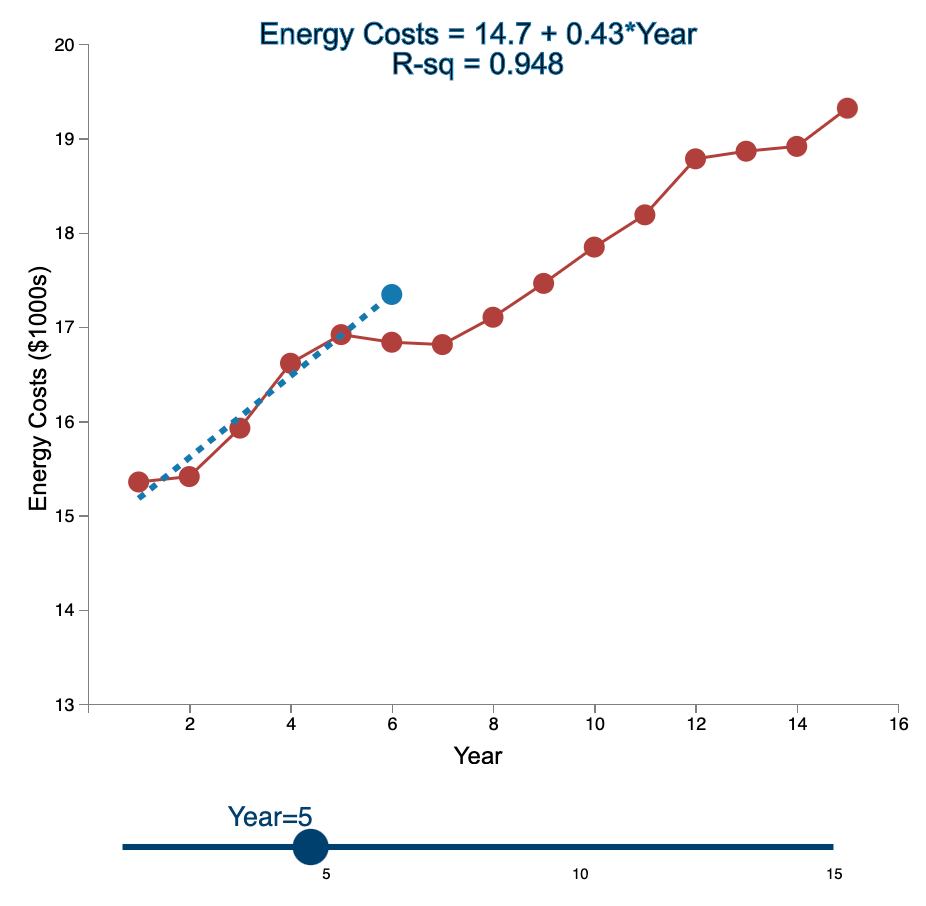
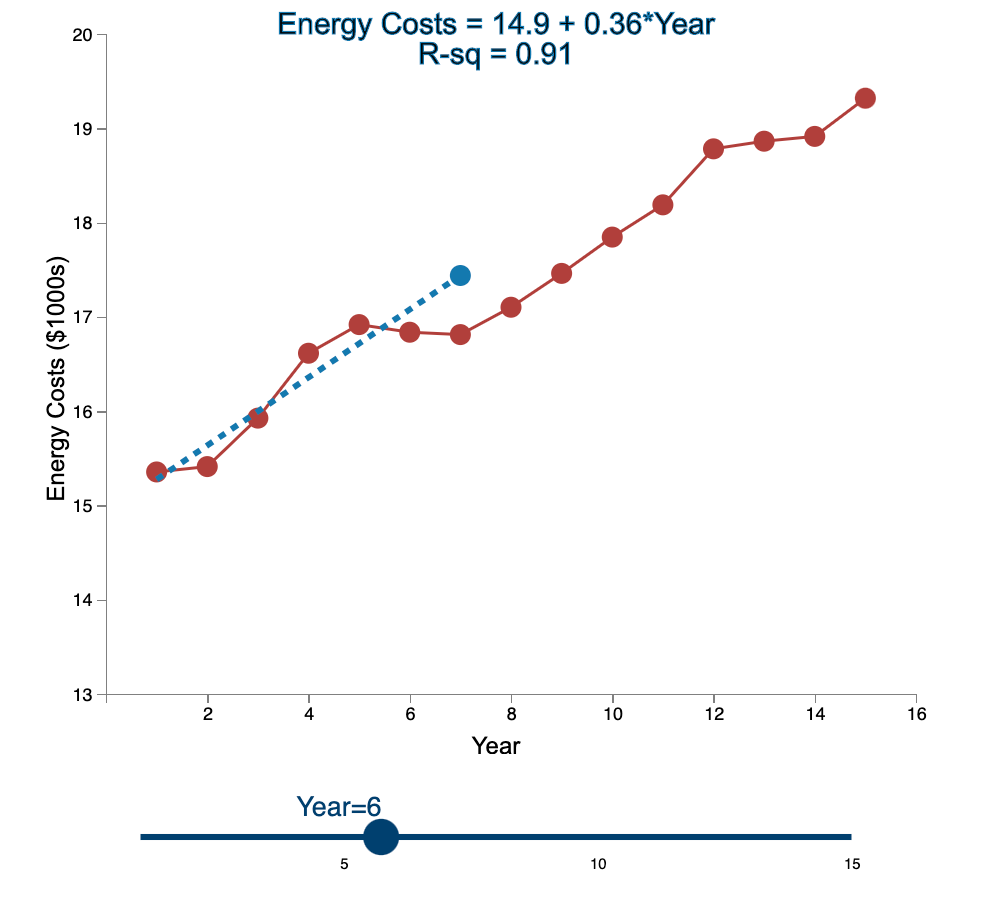
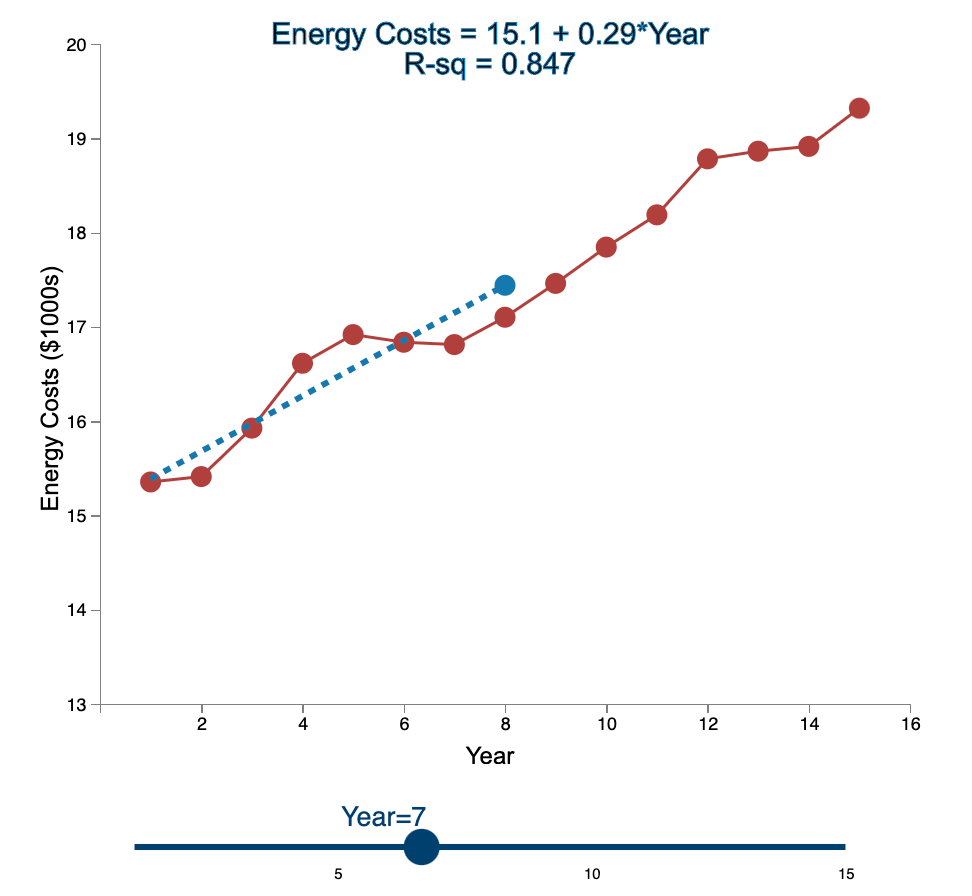
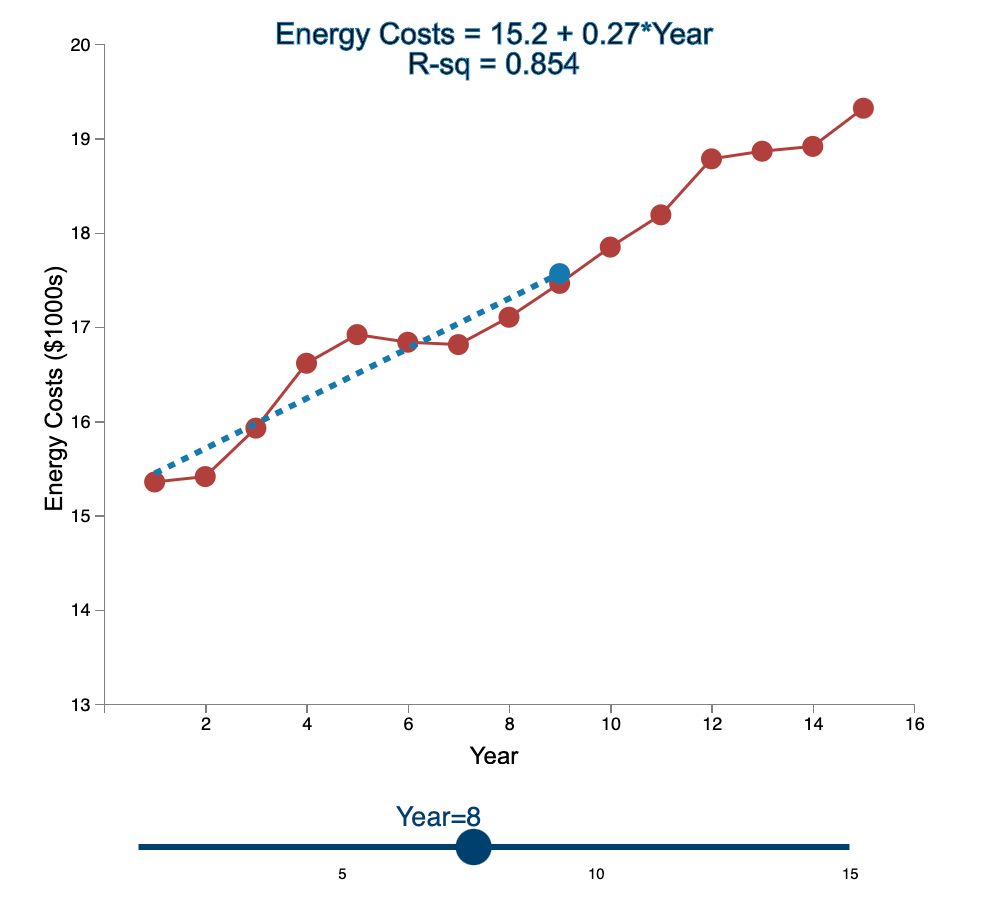
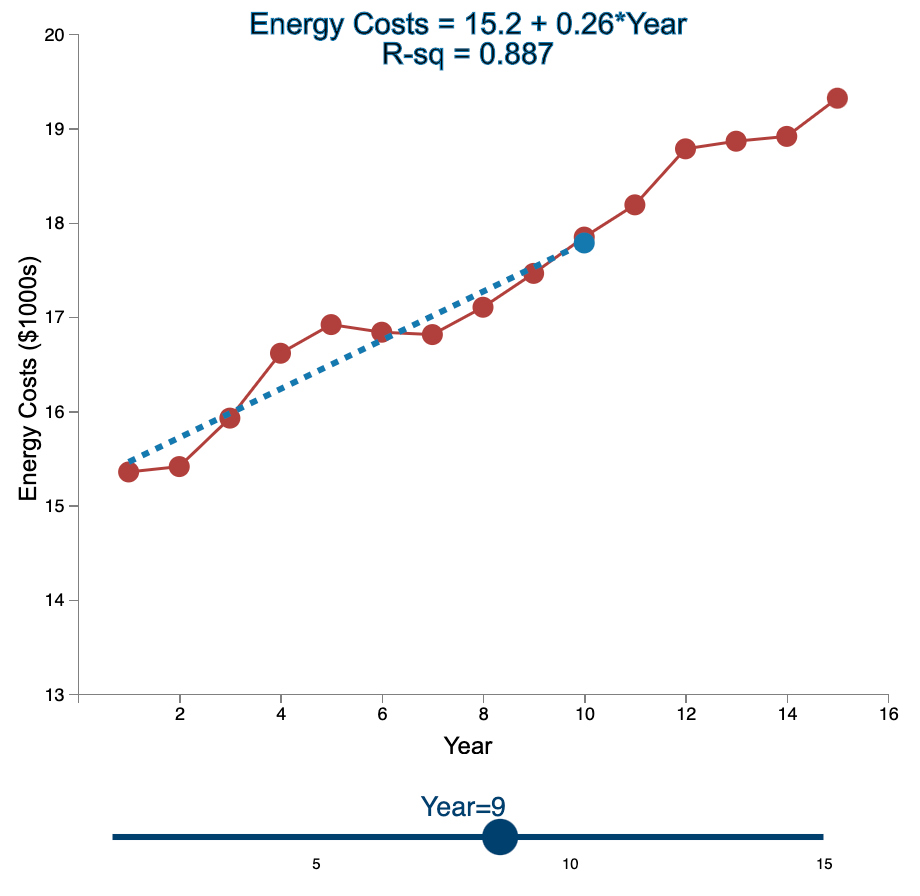
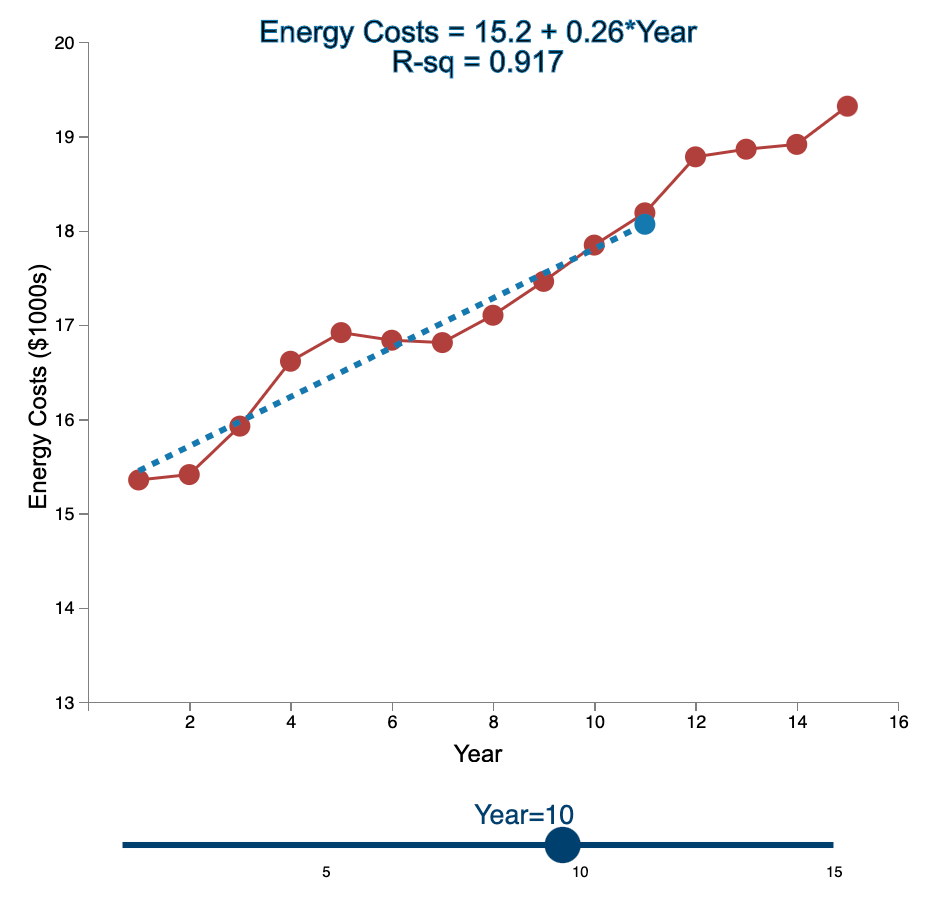

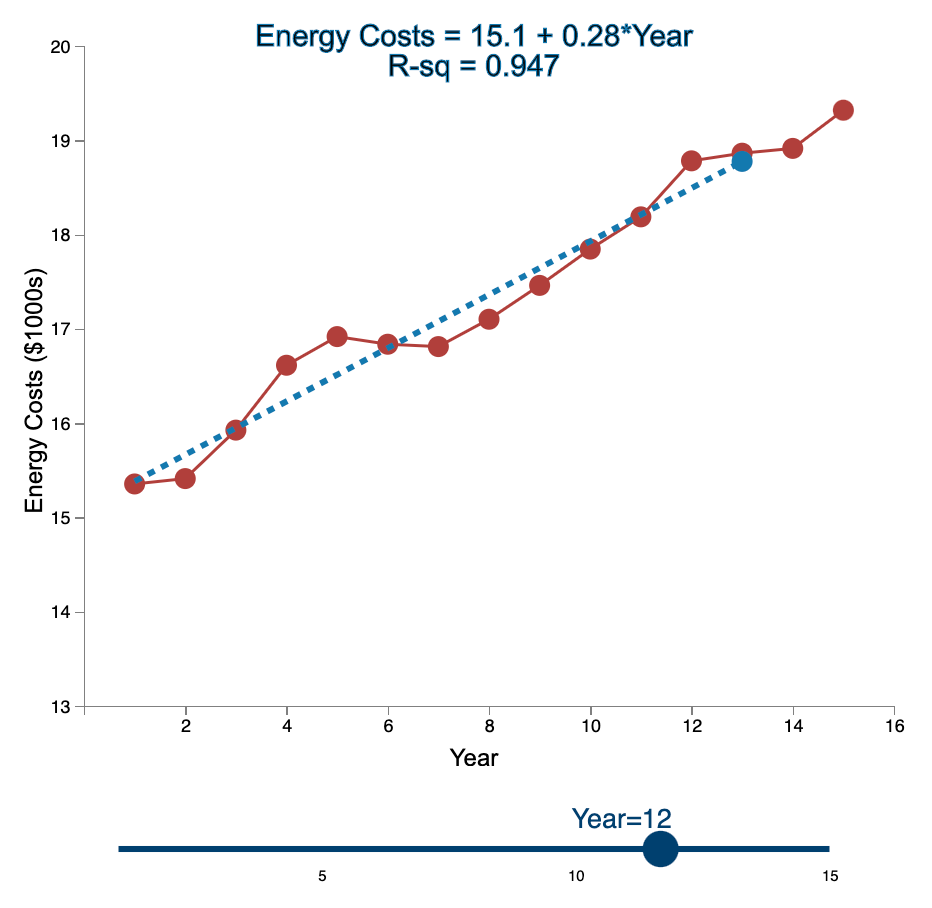
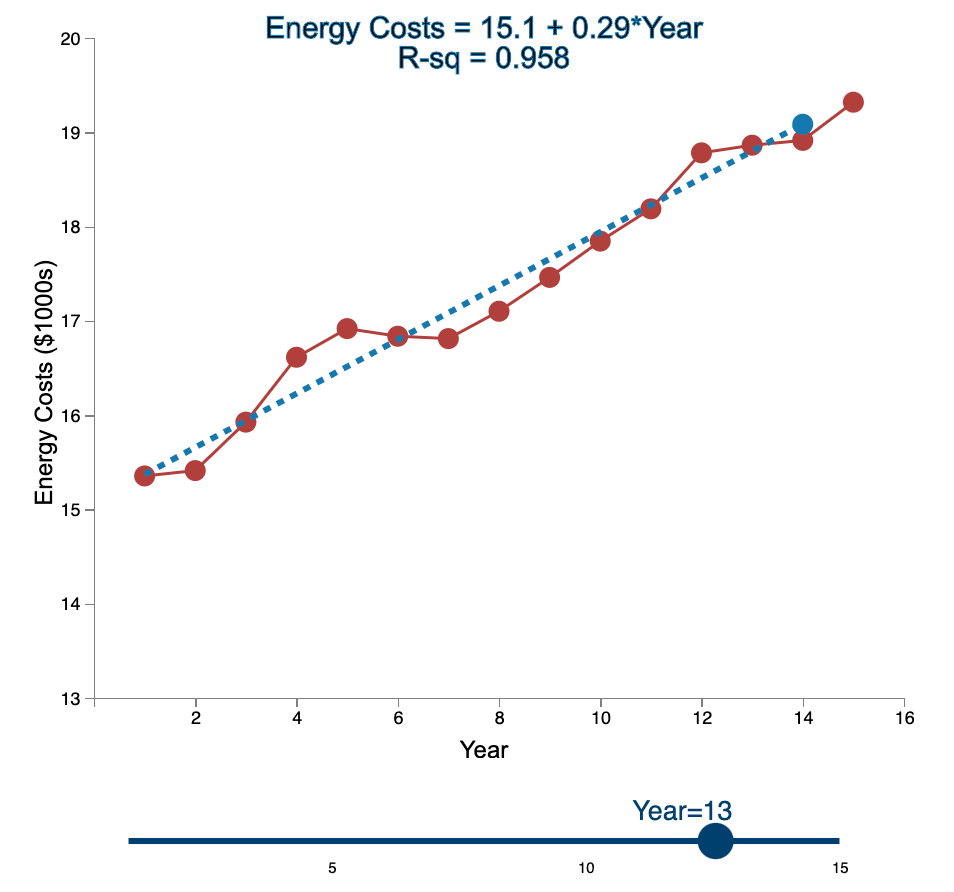
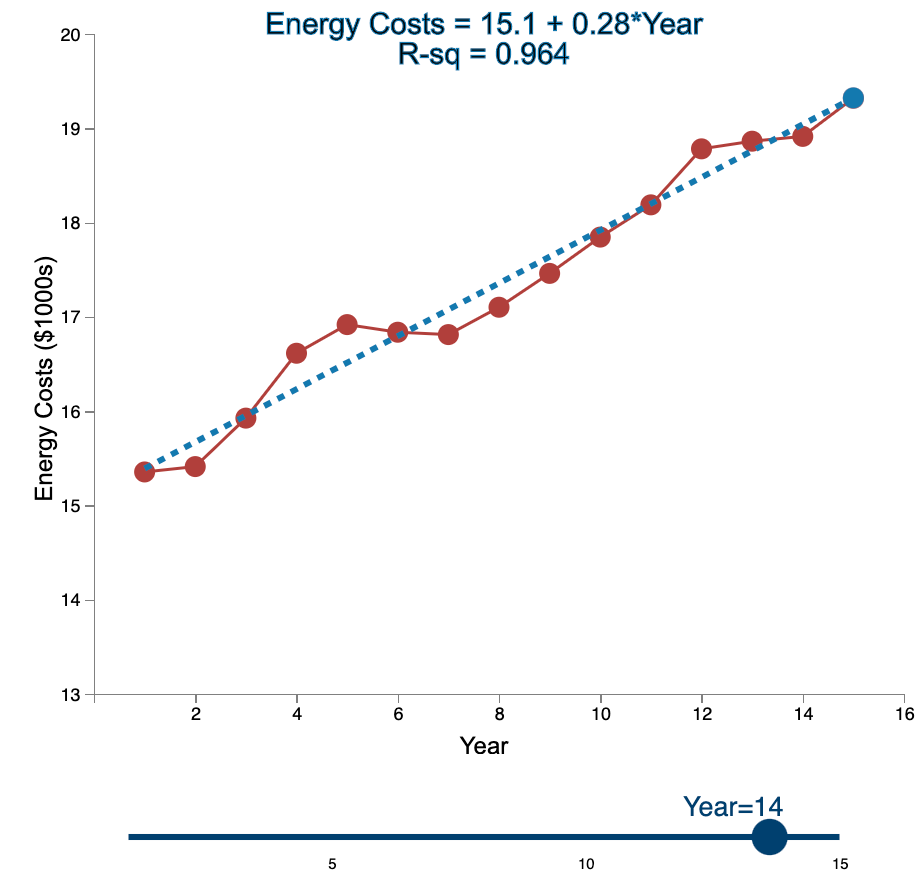
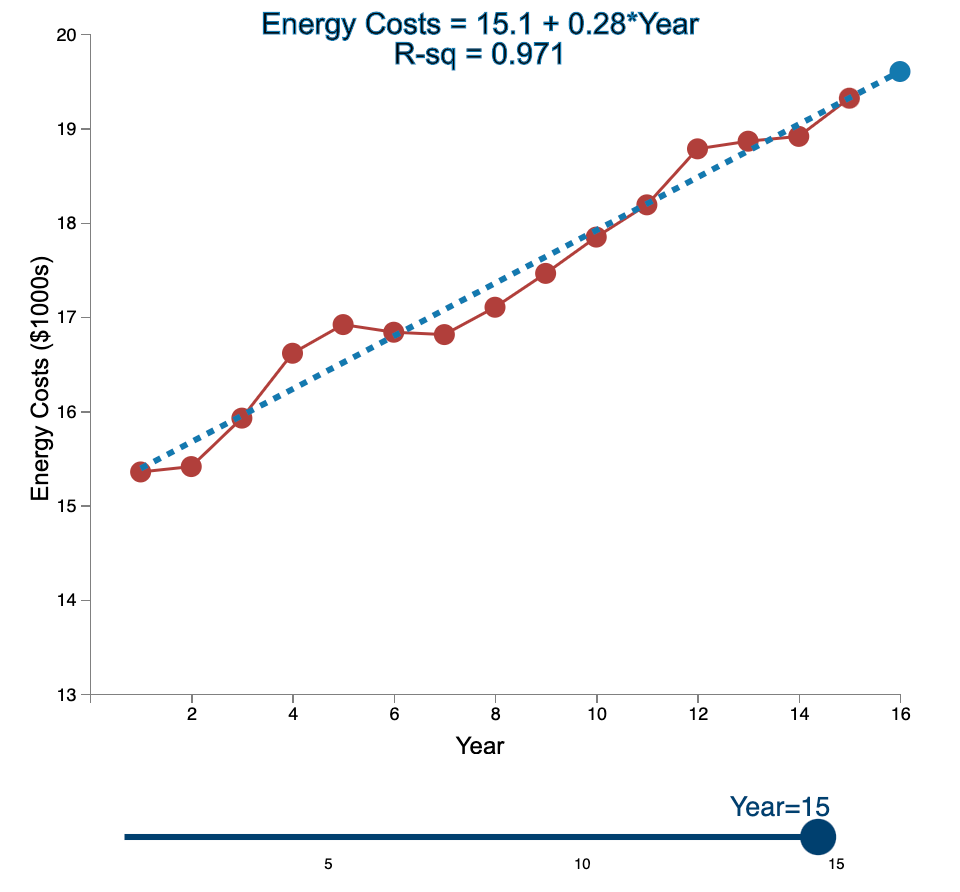
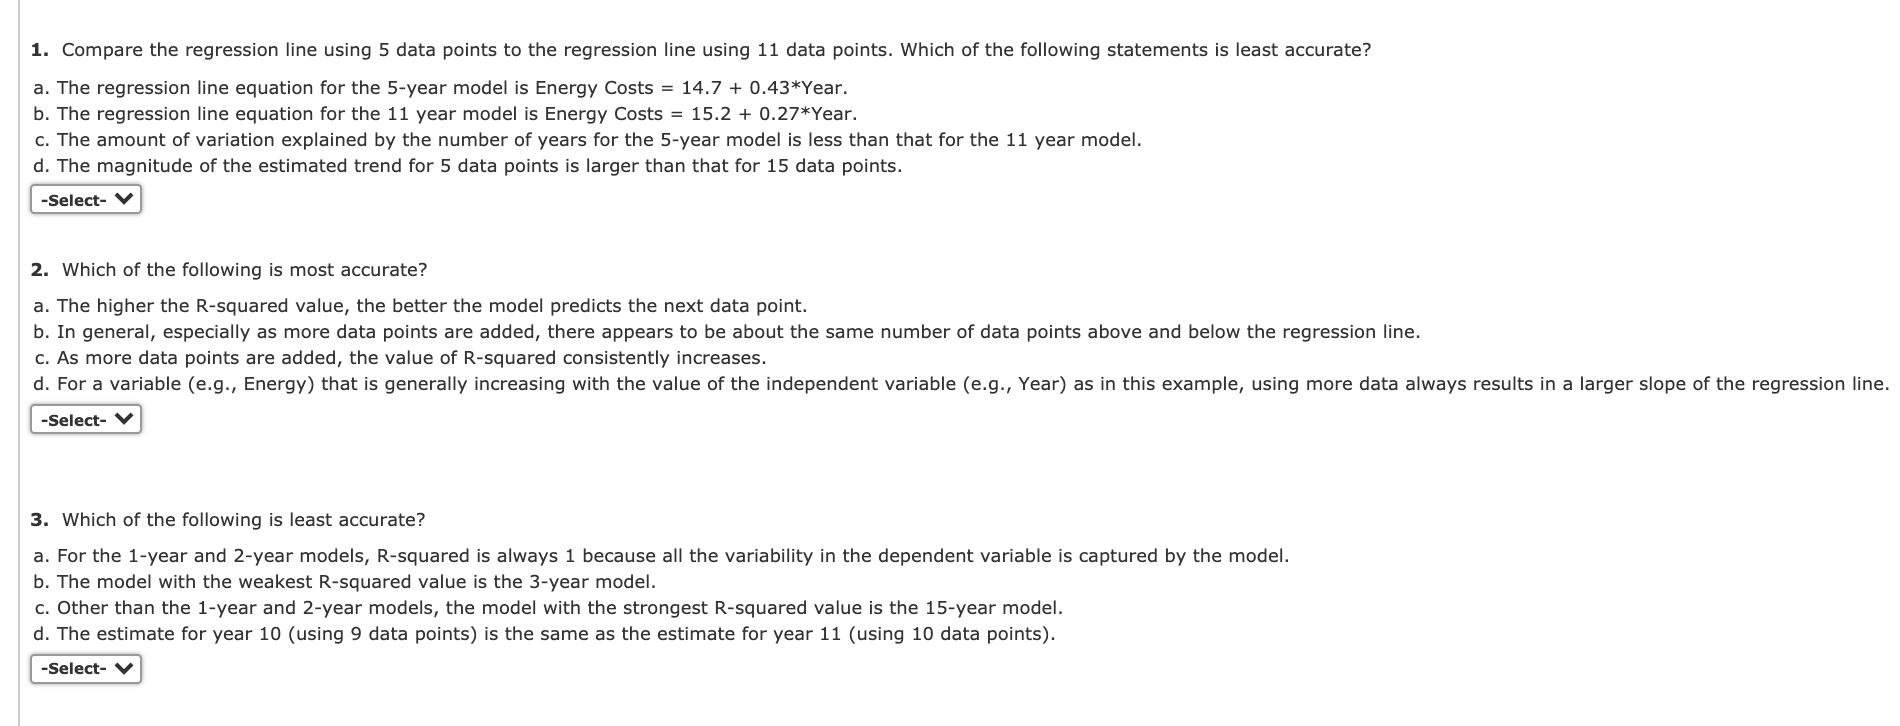
Linear Trend Conceptual Overview: Explore how the linear trend across time provides a forecast. For two or more time series points, we can fit a regression line to provide an estimate of the next observations. In the graph below, the red dots and the solid red line show the time series data. When first loaded, the blue dot and blue dashed line provide the prediction for Year 2 based entirely on the Year 1 observation. As you use the slider to increase the year, the available observations to that point are used to construct a regression line. The prediction is the next point on the line beyond the current year. As you move the slider note that when there are few time points in the early years, the line jumps around a lot. Eventually the line becomes more stable as more time points are added to predict the linear trend. 20 Energy Costs = 15.4 + 0*Year R-sq = 1 19 19 Energy Costs (S1000) 15 14 13 2 4 6 10 12 14 16 a Year Year=1 10 16 Linear Trend Conceptual Overview: Explore how the linear trend across time provides a forecast. For two or more time series points, we can fit a regression line to provide an estimate of the next observations. In the graph below, the red dots and the solid red line show the time series data. When first loaded, the blue dot and blue dashed line provide the prediction for Year 2 based entirely on the Year 1 observation. As you use the slider to increase the year, available observations to that point are used to construct a regression line. The prediction is the next point on the line beyond the current year. As you move the slider note that when there are few time points in the early years, the line jumps around a lot. Eventually the line becomes more stable as more time points are added to predict the linear trend. 20 Energy Costs = 15.3 +0.06*Year R-sq = 1 19 18 Energy Costs (51000) 14 13 4 10 12 14 16 Year Year=2 20 Energy Costs = 15+ 0.29*Year R-sq = 0.824 19 18 Energy Costs ($1000s) 15 14 13 2 4 12 6 8 10 14 16 Year Year=3 5 10 15 20 Energy Costs = 14.8 + 0.43*Year R-sq = 0.899 19 18 Energy Costs ($1000s) 16 15 14 13 2 4 6 8 10 12 14 16 Year Year=4 5 10 15 20 Energy Costs = 14.7 + 0.43*Year R-sq = 0.948 19- 18 17 Energy Costs ($1000s) 16 15- 14 13 2 4 6 10 12 14 16 8 Year Year=5 5 10 15 20 Energy Costs = 14.9 + 0.36*Year R-sq = 0.91 19 18 17 Energy Costs ($1000s) 16 15 14 13 2 4 6 8 10 T 12 14 16 Year Year=6 5 10 15 20 Energy Costs = 15.1 + 0.29*Year R-sq = 0.847 19- 18 Energy Costs ($1000s) 15 14 13 2 4 6 8 10 12 14 16 Year Year=7 5 10 15 20 Energy Costs = 15.2 + 0.27*Year R-sq = 0.854 19 18 Energy Costs ($1000s) 15 14 13 2 4 6 8 10 12 14 16 Year Year=8 5 10 15 20 Energy Costs = 15.2 + 0.26*Year R-sq = 0.887 19 18 17 Energy Costs ($1000s) 16 15 14 13 2 4 6 8 10 12 14 16 Year Year=9 5 10 15 20 Energy Costs = 15.2 +0.26*Year R-sq = 0.917 19 18 Energy Costs ($1000s) 16 15 14 13 2 4 6 10 12 14 16 8 Year Year=10 5 10 15 20 Energy Costs = 15.2 + 0.27*Year R-sq = 0.938 19- 18 Energy Costs ($1000s) 15 14 13 2 4 6 8 10 12 14 16 Year Year=11 5 10 15 20 Energy Costs = 15.1 +0.28*Year R-sq = 0.947 19- 18 17 Energy Costs ($1000s) 16 15 14 13 2 4 6 8 10 12 14 16 Year Year=12 5 10 15 20 Energy Costs = 15.1 + 0.29*Year R-sq = 0.958 19- 18 17 Energy Costs ($1000s) 16 15- 14 13 2 4 6 10 12 14 16 8 Year Year=13 5 10 15 20 Energy Costs = 15.1 +0.28*Year R-sq = 0.964 19 18 17 Energy Costs ($1000s) 16 15 14 13 2 4 6 10 12 14 16 8 Year Year=14 5 10 15 20 Energy Costs = 15.1 + 0.28*Year R-sq = 0.971 19- 18 17 Energy Costs ($1000s) 16 - 15 - 14 13 N 4 6 8 10 12 14 16 Year Year=15 5 10 15 1. Compare the regression line using 5 data points to the regression line using 11 data points. Which of the following statements is least accurate? a. The regression line equation for the 5-year model is Energy Costs = 14.7 + 0.43*Year. b. The regression line equation for the 11 year model is Energy Costs = 15.2 + 0.27*Year. c. The amount of variation explained by the number of years for the 5-year model is less than that for the 11 year model. d. The magnitude of the estimated trend for 5 data points is larger than that for 15 data points. -Select- 2. Which of the following is most accurate? a. The higher the R-squared value, the better the model predicts the next data point. b. In general, especially as more data points are added, there appears to be about the same number of data points above and below the regression line. c. As more data points are added, the value of R-squared consistently increases. d. For a variable (e.g., Energy) that is generally increasing with the value of the independent variable (e.g., Year) as in this example, using more data always results in a larger slope of the regression line. -Select- 3. Which of the following is least accurate? a. For the 1-year and 2-year models, R-squared is always 1 because all the variability in the dependent variable is captured by the model. b. The model with the weakest R-squared value is the 3-year model. c. Other than the 1-year and 2-year models, the model with the strongest R-squared value is the 15-year model. d. The estimate for year 10 (using 9 data points) is the same as the estimate for year 11 (using 10 data points). -Select


