

Question: Look at the image below . This image is a short report but with a very poor design. You have to format and design this
Look at the image below . This image is a short report but with a very poor design. You have to format and design this short report so that it is professional, appealing, and functional. DO NOT CHANGE THE CONTENT...ONLY THE REPORT'S DESIGN!
Professional: Smart design choices for purpose, and high quality.
Appealing: Draws attention to a creative, well-formatted, and attractive report.
Functional: Organized well and clearly designed sections that make reading easy and comfortable.
2) use the word doc file to edit the short report in the following ways.
Report Requirements:
a) Add a title.
b) The report should include the following clearly designed sections:
purpose or background for the report,
problems/issues,
findings/conclusions,
recommendations
c) Make the Visual Aids easy to find, well-positioned, or placed near the text they match, and big enough to read easily.
Report Considerations:
a) Format
b) Organization of content
c) Placement of Visual Aids
d) Font type and size choices
e) Head Title and Subtitles
f) Use of colour
g) Use of added graphics or design features
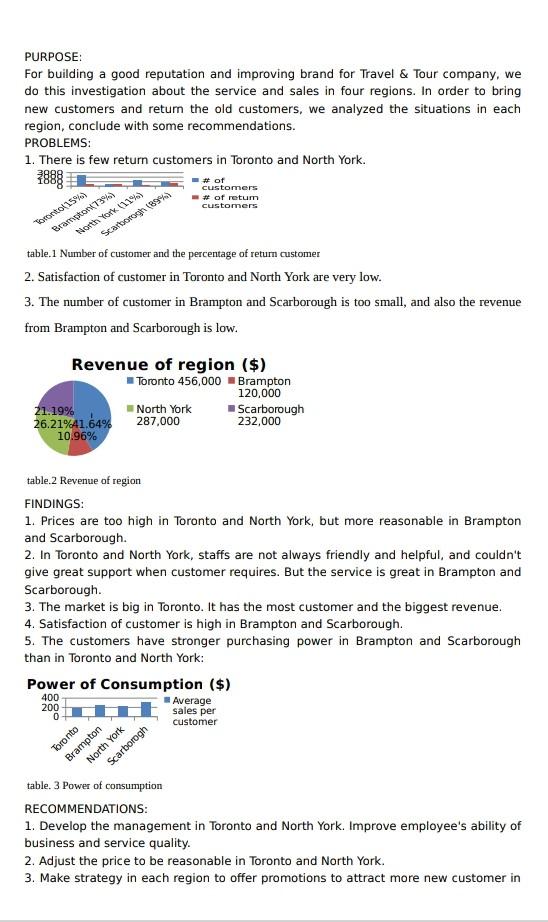
PURPOSE: For building a good reputation and improving brand for Travel & Tour company, we do this investigation about the service and sales in four regions. In order to bring new customers and return the old customers, we analyzed the situations in each region, conclude with some recommendations. PROBLEMS: 1. There is few return customers in Toronto and North York. 2888 # of customers # of retum customers table.1 Number of customer and the percentage of return customer 2. Satisfaction of customer in Toronto and North York are very low. 3. The number of customer in Brampton and Scarborough is too small, and also the revenue from Brampton and Scarborough is low. Revenue of region ($) Toronto 456,000 Brampton 120,000 21.19% North York 287,000 Scarborough 232,000 26.21% 41.64% 10.96% table.2 Revenue of region FINDINGS: 1. Prices are too high in Toronto and North York, but more reasonable in Brampton and Scarborough. 2. In Toronto and North York, staffs are not always friendly and helpful, and couldn't give great support when customer requires. But the service is great in Brampton and Scarborough. 3. The market is big in Toronto. It has the most customer and the biggest revenue. 4. Satisfaction of customer is high in Brampton and Scarborough. 5. The customers have stronger purchasing power in Brampton and Scarborough than in Toronto and North York: Power of Consumption ($) 400 200 Average sales per customer 0 table. 3 Power of consumption RECOMMENDATIONS: 1. Develop the management in Toronto and North York. Improve employee's ability of business and service quality. 2. Adjust the price to be reasonable in Toronto and North York. 3. Make strategy in each region to offer promotions to attract more new customer in Toronto(15%) Brampton(73%) North York (11%) Toronto Scarborogh (89%) Brampton North York Scarborogh
Step by Step Solution
There are 3 Steps involved in it

Get step-by-step solutions from verified subject matter experts