

Question: Look at the two histograms below Each involves the same number of data The data are all whole numbers so the height of each bar

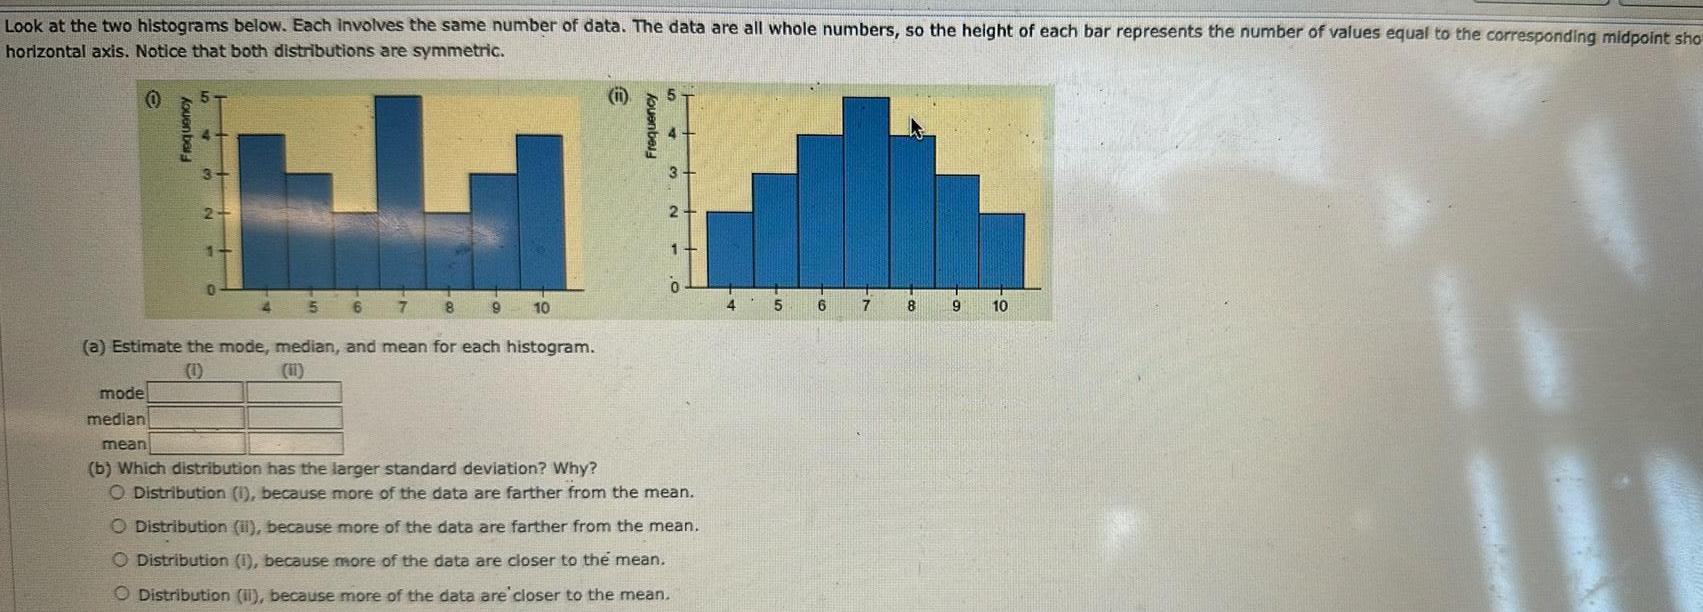
Look at the two histograms below Each involves the same number of data The data are all whole numbers so the height of each bar represents the number of values equal to the corresponding midpoint sho horizontal axis Notice that both distributions are symmetric 0 Frequency 4 5 6 7 8 9 10 a Estimate the mode median and mean for each histogram 4 3 2 1 0 mode median mean b Which distribution has the larger standard deviation Why O Distribution 1 because more of the data are farther from the mean O Distribution i because more of the data are farther from the mean O Distribution 1 because more of the data are closer to the mean O Distribution II because more of the data are closer to the mean 4 5 6 7 8 9 10
Step by Step Solution
There are 3 Steps involved in it

Get step-by-step solutions from verified subject matter experts