

Question: Look up the Logistic Map equation: x n + 1 = r x n ( 1 - x n ) , Implement a plot of
Look up the Logistic Map equation:
Implement a plot of this equation in this matlab code:
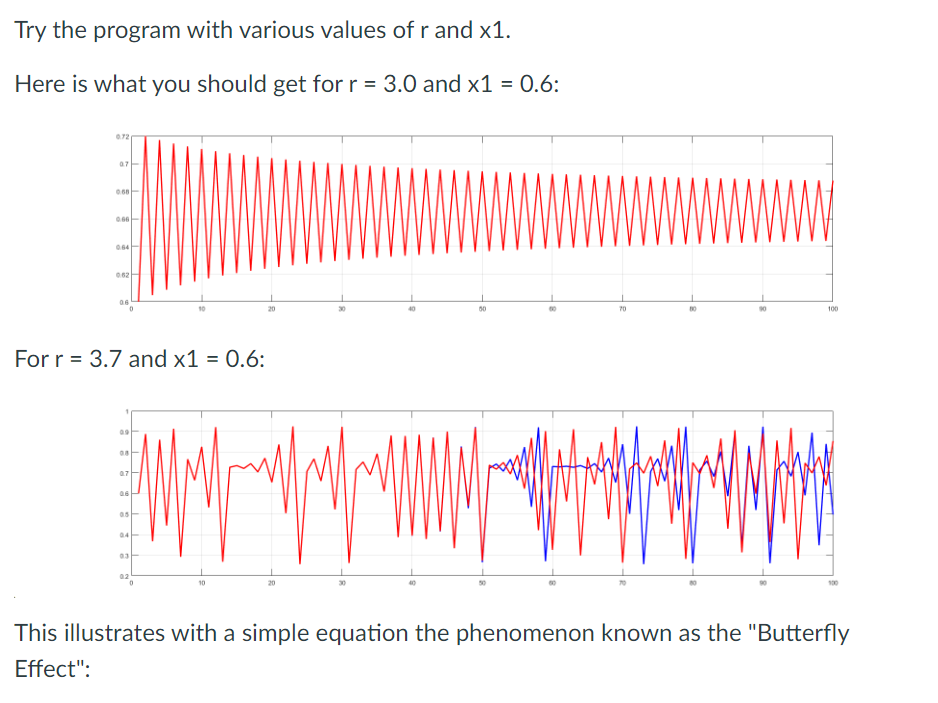
Try the program with various values of and
Here is what you should get for and :
For and :
This illustrates with a simple equation the phenomenon known as the "Butterfly
Effect":XMAX ;
x zeros XMAX;
r inputEnter r: to ;
x inputEnter initial x: to ;
Compute and plot the logistic equation
for x through XMAX with a blue line.
Compute and plot the logistic equation
for xe through XMAX with a red line.
Both plots should be on the same graph.
After how many iterations do the plots
diverge for r
Step by Step Solution
There are 3 Steps involved in it
1 Expert Approved Answer
Step: 1 Unlock

Question Has Been Solved by an Expert!
Get step-by-step solutions from verified subject matter experts
Step: 2 Unlock
Step: 3 Unlock