

Question: Make a histogram of these data. (You'll use this same list for other questions in this activity, so you may want to enter the numbers
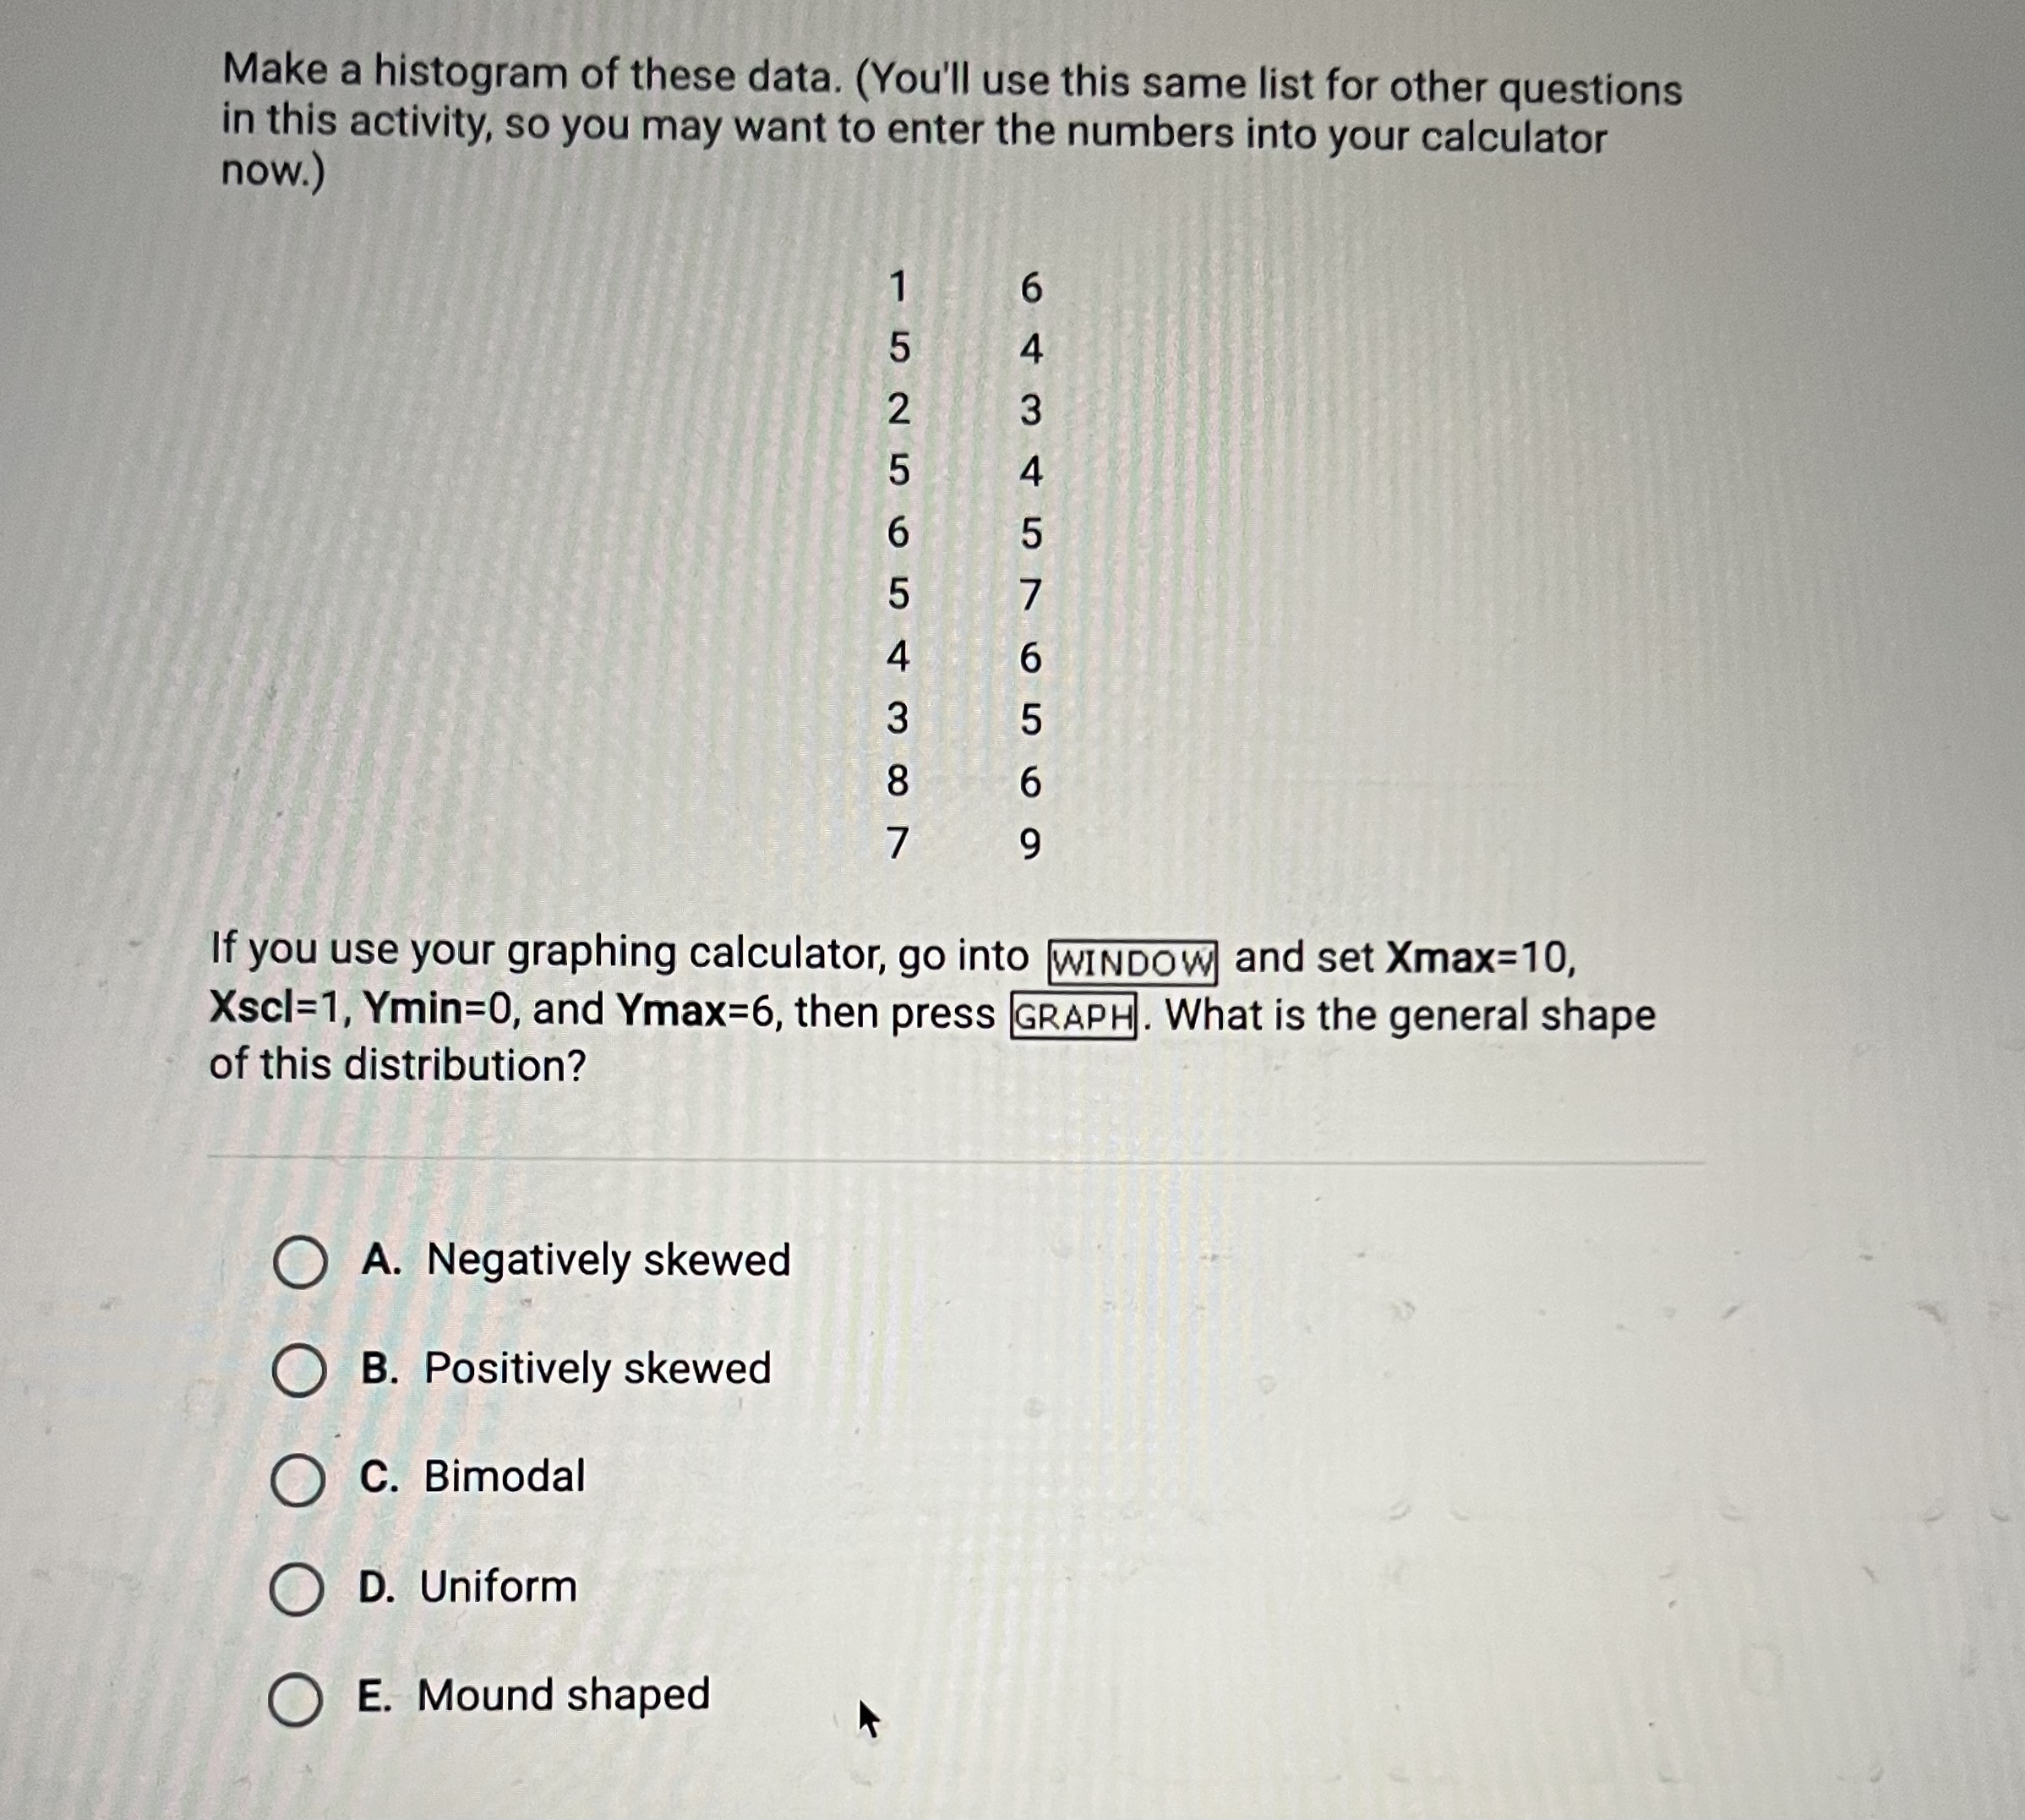

Make a histogram of these data. (You'll use this same list for other questions in this activity, so you may want to enter the numbers into your calculator now.) a UT O V U A WA O If you use your graphing calculator, go into WINDOW and set Xmax=10, Xscl=1, Ymin=0, and Ymax=6, then press GRAPH. What is the general shape of this distribution? O A. Negatively skewed B. Positively skewed O C. Bimodal D. Uniform O E. Mound shaped
Step by Step Solution
There are 3 Steps involved in it
1 Expert Approved Answer
Step: 1 Unlock

Question Has Been Solved by an Expert!
Get step-by-step solutions from verified subject matter experts
Step: 2 Unlock
Step: 3 Unlock