Question: make an x bar and r chart with data 4 Sample 1 Sample 2 Sample 3 Sample 4 Sample 5 1.98 1.99 2.2 2.18 2.01

make an x bar and r chart with data make an x bar and r chart with data 4 Sample 1
4 Sample 1 Sample 2 Sample 3 Sample 4 Sample 5 1.98 1.99 2.2 2.18 2.01 2.11 2 2.1 2.01 2.08 2.15 2.08 2.2 2.23 2.14 2.06 1.99 2.05 1.98 2.16 2.075 2015 2.1375 2.1 2.0975 2.15 2.08 2.2 2.23 2.16 1.98 1.99 2.05 1.98 2.01 0.12 0.09 0.15 0.25 0.15 0.162 2.085 0.729 6 Average 7 Max 8 Min 9 Range 10 Aug of Ranges (R-bar) 11 Avg of Averages (x-barbar) 12 A2 for n-4 (from table 56.1) 13 14 UCLex-barbar + A2R-bar 15 LCL-x-barbar - A2R-bar 16 17 UCL 18 La 19 2.203098 1.966902

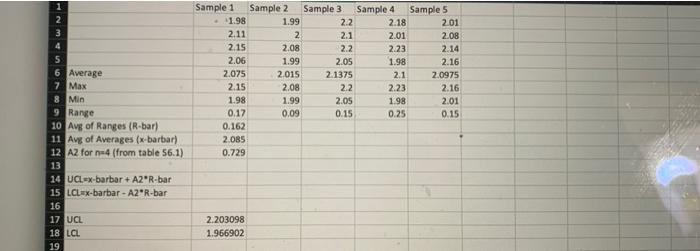
Step by Step Solution

There are 3 Steps involved in it

1 Expert Approved Answer
Step: 1 Unlock blur-text-image
Question Has Been Solved by an Expert!

Get step-by-step solutions from verified subject matter experts

Step: 2 Unlock
Step: 3 Unlock

Students Have Also Explored These Related General Management Questions!