

Question: Make sure to include the equilibrium plot point as well please The following graph depicts the supply schedule for euros (orange line) and the demand
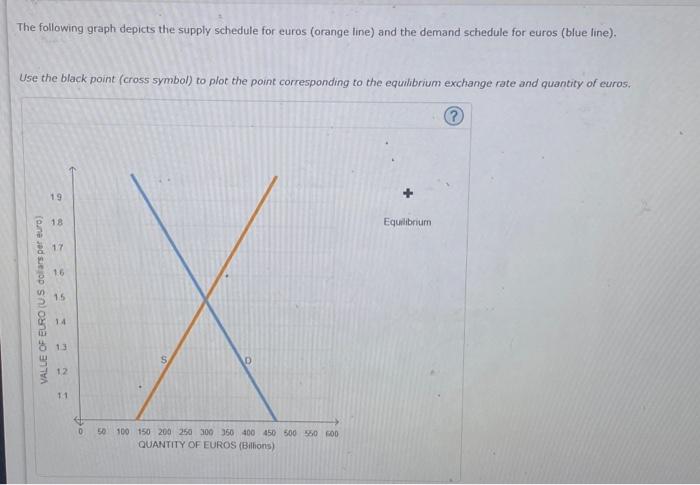
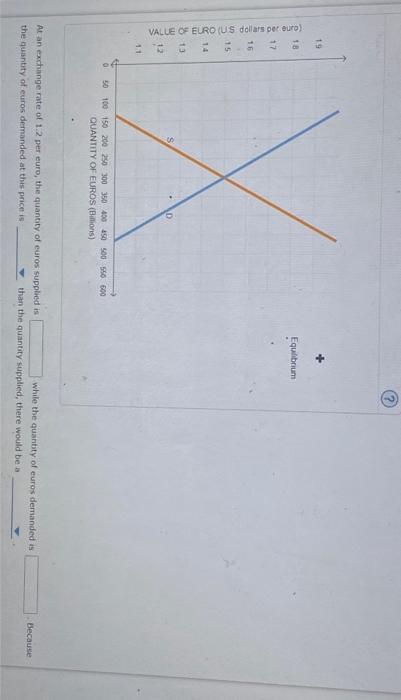
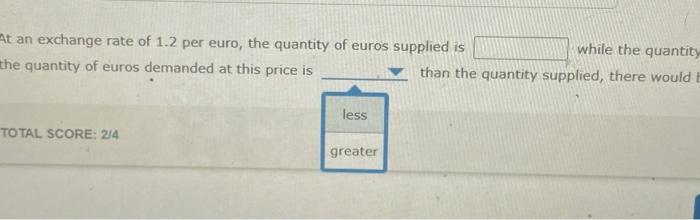
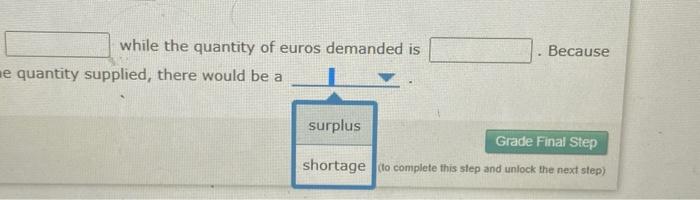
The following graph depicts the supply schedule for euros (orange line) and the demand schedule for euros (blue line). Use the black point (cross symbol) to plot the point corresponding to the equibrium exchange rate and quantity of euros. At an exchange rate of 1.2 per euro, the quantity of euros supplied is while the quantity of euros demanded is the quantity of euros demanded at this price is than the quantity supplied, there would be a At an exchange rate of 1.2 per euro, the quantity of euros supplied is while the quantit the quantity of euros demanded at this price is than the quantity supplied, there would TOTAL SCORE: 2/4 while the quantity of euros demanded is Because quantity supplied, there would be a lo complete this step and uniock the next step)
Step by Step Solution
There are 3 Steps involved in it

Get step-by-step solutions from verified subject matter experts