

Question: Math help Use a calculator or computer software to generate a normal quantile plot for the data in the accompanying table. Then determine whether the
Math help
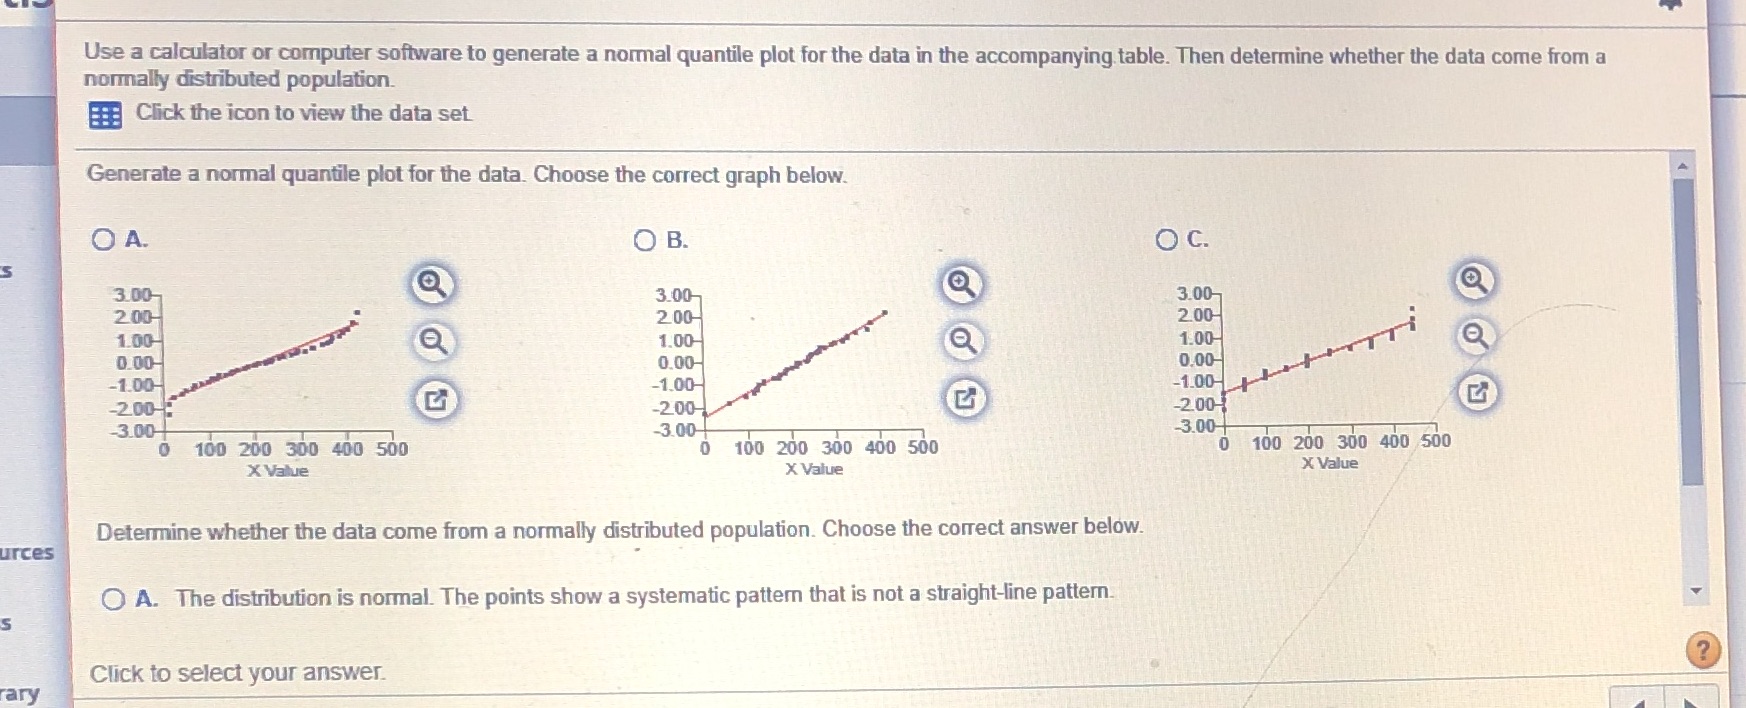
Use a calculator or computer software to generate a normal quantile plot for the data in the accompanying table. Then determine whether the data come from a normally distributed population. Click the icon to view the data set Generate a normal quantile plot for the data. Choose the correct graph below. O A. O B. O C. 3.00- 2 00- 3.00- O 3.00 1.00- 200 2.00- 0.00- 1.00- 1:00- -1.00- 0.00- -1.00- 0.00 -2.0045 -200- -1.00- -3.00 100 200 300 400 500 -3.00 -200- 0 100 200 300 400 500 3.00 X Value X Value 0 100 200 300 400 500 X Value urces Determine whether the data come from a normally distributed population. Choose the correct answer below. O A. The distribution is normal. The points show a systematic pattern that is not a straight-line pattern. ary Click to select your answer.
Step by Step Solution
There are 3 Steps involved in it

Get step-by-step solutions from verified subject matter experts