

Question: Please help me with this question Use a calculator or computer software to generate a normal quantile plot for the data in the accompanying table.
Please help me with this question
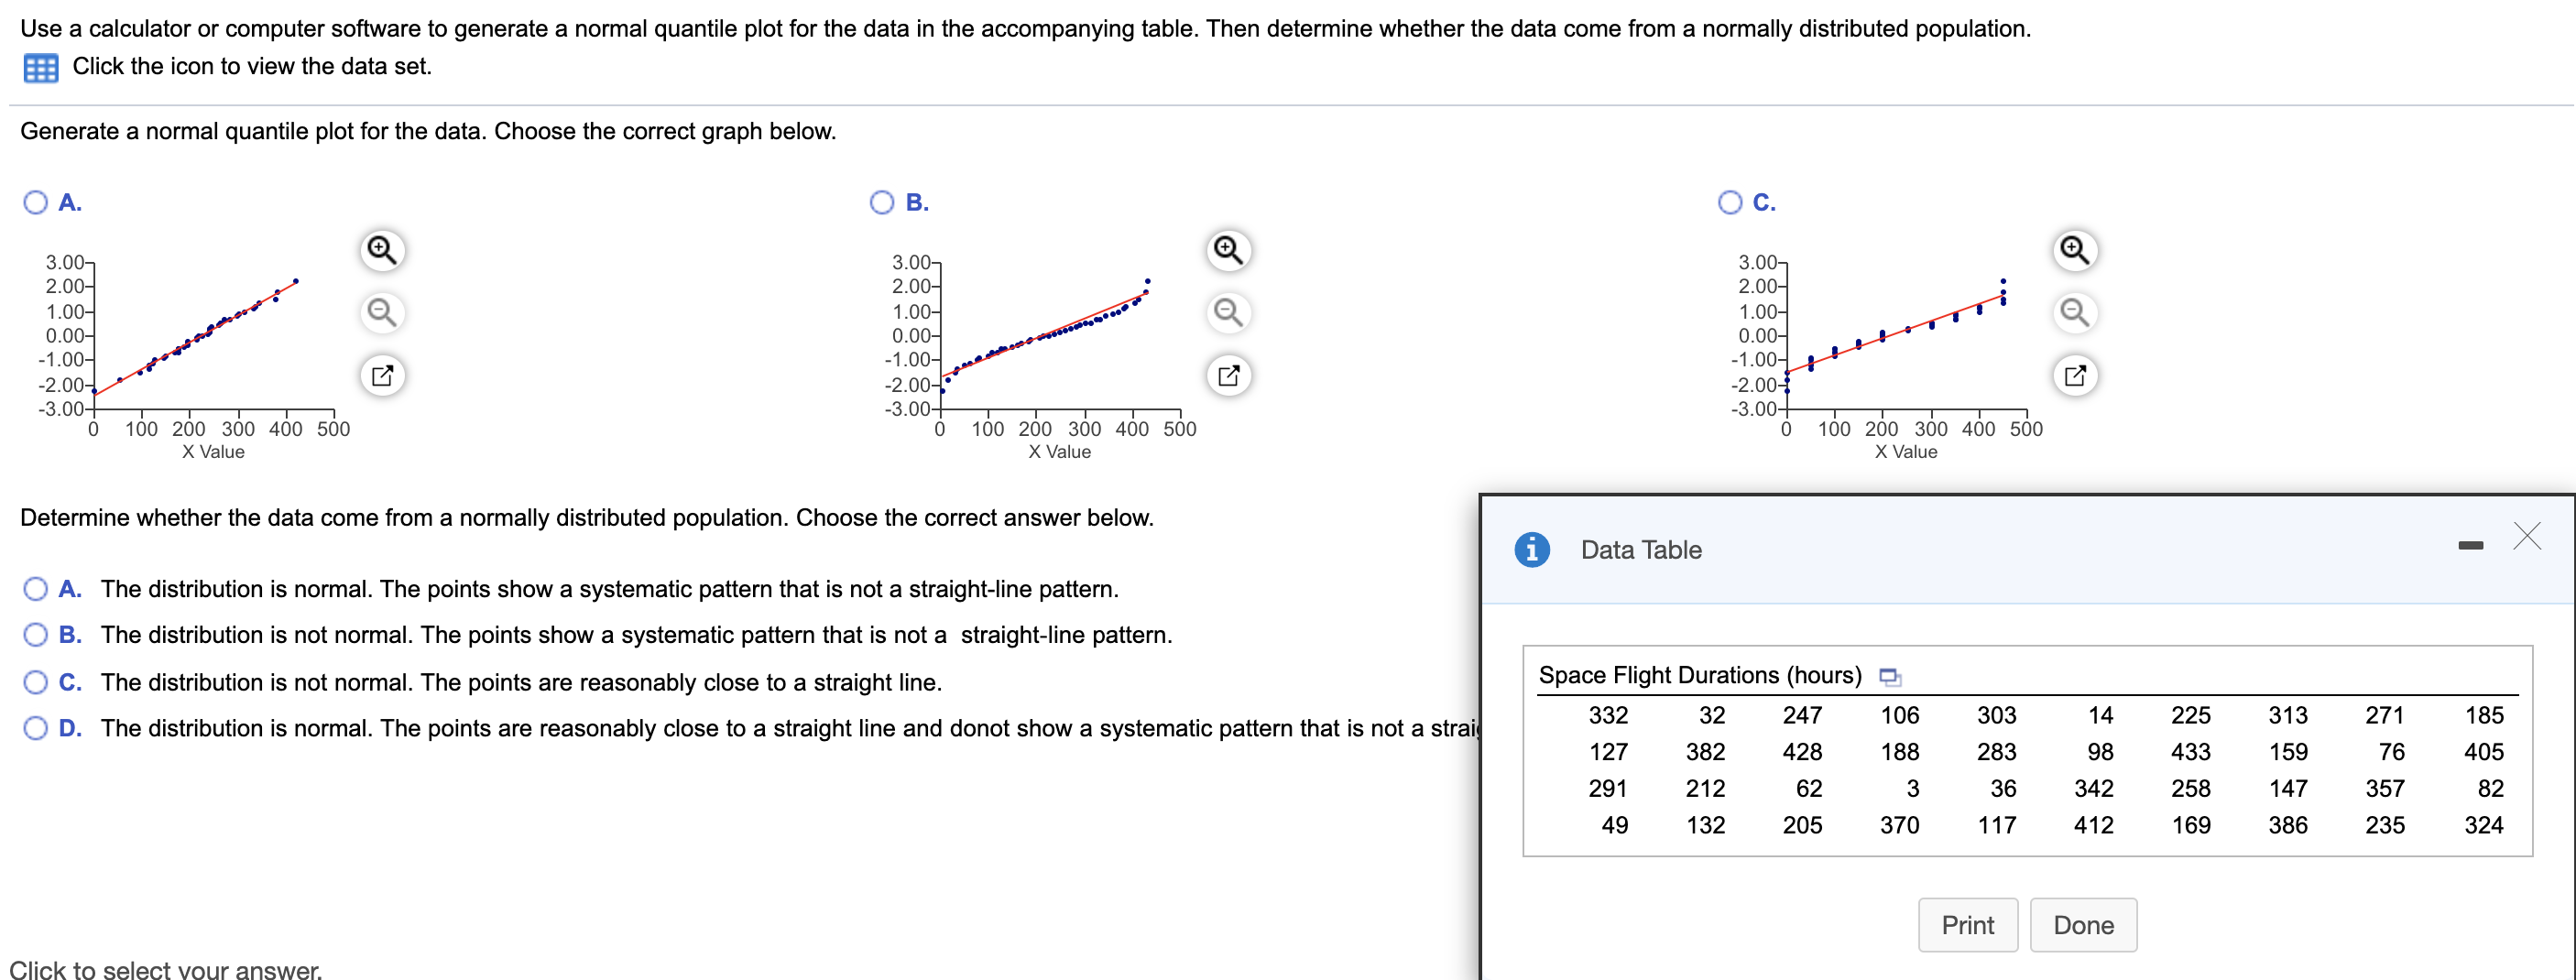
Use a calculator or computer software to generate a normal quantile plot for the data in the accompanying table. Then determine whether the data come from a normally distributed population. Click the icon to view the data set. Generate a normal quantile plot for the data. Choose the correct graph below. O A. O B. O C. 3.00- 3.00- 3.00- 2.00- 2.00- 2.00- 1.00- 1.00- 1.00- 0.00- 0.00- 0.00- -1.00- -1.00- -2.00- -2.00- -1.00- -2.00- -3.00+ 100 200 300 400 500 -3.00+ 0 100 200 300 400 500 -3.00-+ 0 100 200 300 400 500 X Value X Value X Value Determine whether the data come from a normally distributed population. Choose the correct answer below. i Data Table - X A. The distribution is normal. The points show a systematic pattern that is not a straight-line pattern. O B. The distribution is not normal. The points show a systematic pattern that is not a straight-line pattern. O C. The distribution is not normal. The points are reasonably close to a straight line. Space Flight Durations (hours) O D. The distribution is normal. The points are reasonably close to a straight line and donot show a systematic pattern that is not a strais 332 32 247 106 303 14 225 313 271 185 127 382 428 188 283 98 433 159 76 405 291 212 62 3 36 342 258 147 357 82 49 132 205 370 117 412 169 386 235 324 Print Done
Step by Step Solution
There are 3 Steps involved in it

Get step-by-step solutions from verified subject matter experts