

Question: *MatLAB code for problem 1 (logistic growth) *graph from MatLAB code 1. Recal the logistic map, the discrete form of logistic growth model, where with
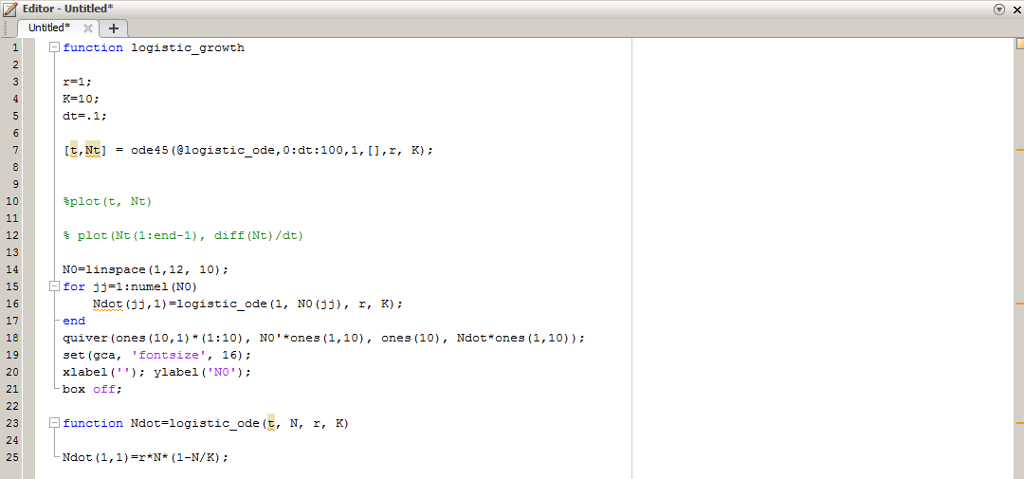
*MatLAB code for problem 1 (logistic growth)
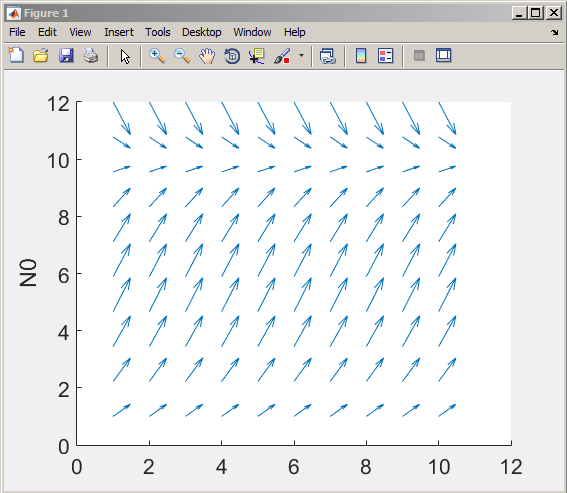
*graph from MatLAB code
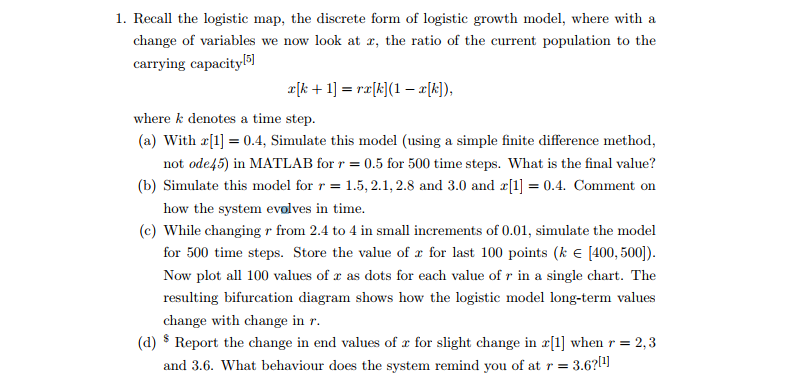
1. Recal the logistic map, the discrete form of logistic growth model, where with a change of variables we now look at , the ratio of the current population to the carrying capacity [++ 1] = r(1-). where k denotes a time step. (a) With 0.4, Simulate this model (using a simple finite difference method, not ode45) in MATLAB for r = 0.5 for 500 time steps. What is the final value? (b) Simulate this model for r = 1.5, 2.1, 2.8 and 3.0 and r[1] 0.4. Comment on how the system evolves in time. (c) While changing r from 2.4 to 4 in small increments of 0.01, simulate the model for 500 time steps. Store the value of a for last 100 points (k E [400,500]) Now plot all 100 values of r as dots for each value of r in a single chart. The resulting bifurcation diagram shows how the logistic model long-term values change with change in r. (d) s Report the change in end values of z for slight change in z[1] when r = 2.3 and 3.6. What behaviour does the system remind you of at r = 3.6? 1. Recal the logistic map, the discrete form of logistic growth model, where with a change of variables we now look at , the ratio of the current population to the carrying capacity [++ 1] = r(1-). where k denotes a time step. (a) With 0.4, Simulate this model (using a simple finite difference method, not ode45) in MATLAB for r = 0.5 for 500 time steps. What is the final value? (b) Simulate this model for r = 1.5, 2.1, 2.8 and 3.0 and r[1] 0.4. Comment on how the system evolves in time. (c) While changing r from 2.4 to 4 in small increments of 0.01, simulate the model for 500 time steps. Store the value of a for last 100 points (k E [400,500]) Now plot all 100 values of r as dots for each value of r in a single chart. The resulting bifurcation diagram shows how the logistic model long-term values change with change in r. (d) s Report the change in end values of z for slight change in z[1] when r = 2.3 and 3.6. What behaviour does the system remind you of at r = 3.6
Step by Step Solution
There are 3 Steps involved in it

Get step-by-step solutions from verified subject matter experts