

Question: Using the equation that gives the concentration profile as a function of spatial coordinate, x, and time, t, for a point (or planar) source
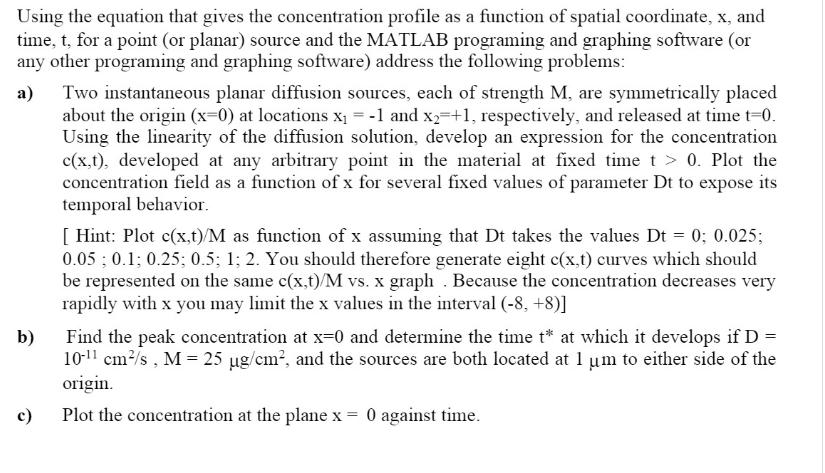
Using the equation that gives the concentration profile as a function of spatial coordinate, x, and time, t, for a point (or planar) source and the MATLAB programing and graphing software (or any other programing and graphing software) address the following problems: a) Two instantaneous planar diffusion sources, each of strength M, are symmetrically placed about the origin (x=0) at locations x = -1 and x2 +1, respectively, and released at time t=0. Using the linearity of the diffusion solution, develop an expression for the concentration c(x,t), developed at any arbitrary point in the material at fixed time t > 0. Plot the concentration field as a function of x for several fixed values of parameter Dt to expose its temporal behavior. b) [Hint: Plot c(x,t)/M as function of x assuming that Dt takes the values Dt = 0; 0.025; 0.05; 0.1; 0.25; 0.5; 1; 2. You should therefore generate eight c(x,t) curves which should be represented on the same c(x,t)/M vs. x graph. Because the concentration decreases very rapidly with x you may limit the x values in the interval (-8, +8)] Find the peak concentration at x=0 and determine the time t* at which it develops if D = 10-11 cm/s, M=25 ug/cm, and the sources are both located at 1 m to either side of the origin. c) Plot the concentration at the plane x = 0 against time.
Step by Step Solution
There are 3 Steps involved in it
It seems there was still no image attac... View full answer

Get step-by-step solutions from verified subject matter experts