

Question: MBF 3C1 Name: Solving Problems using statistics Compare sets of data by analysing and interpreting measures of central tendency and measures of spread. Example 1
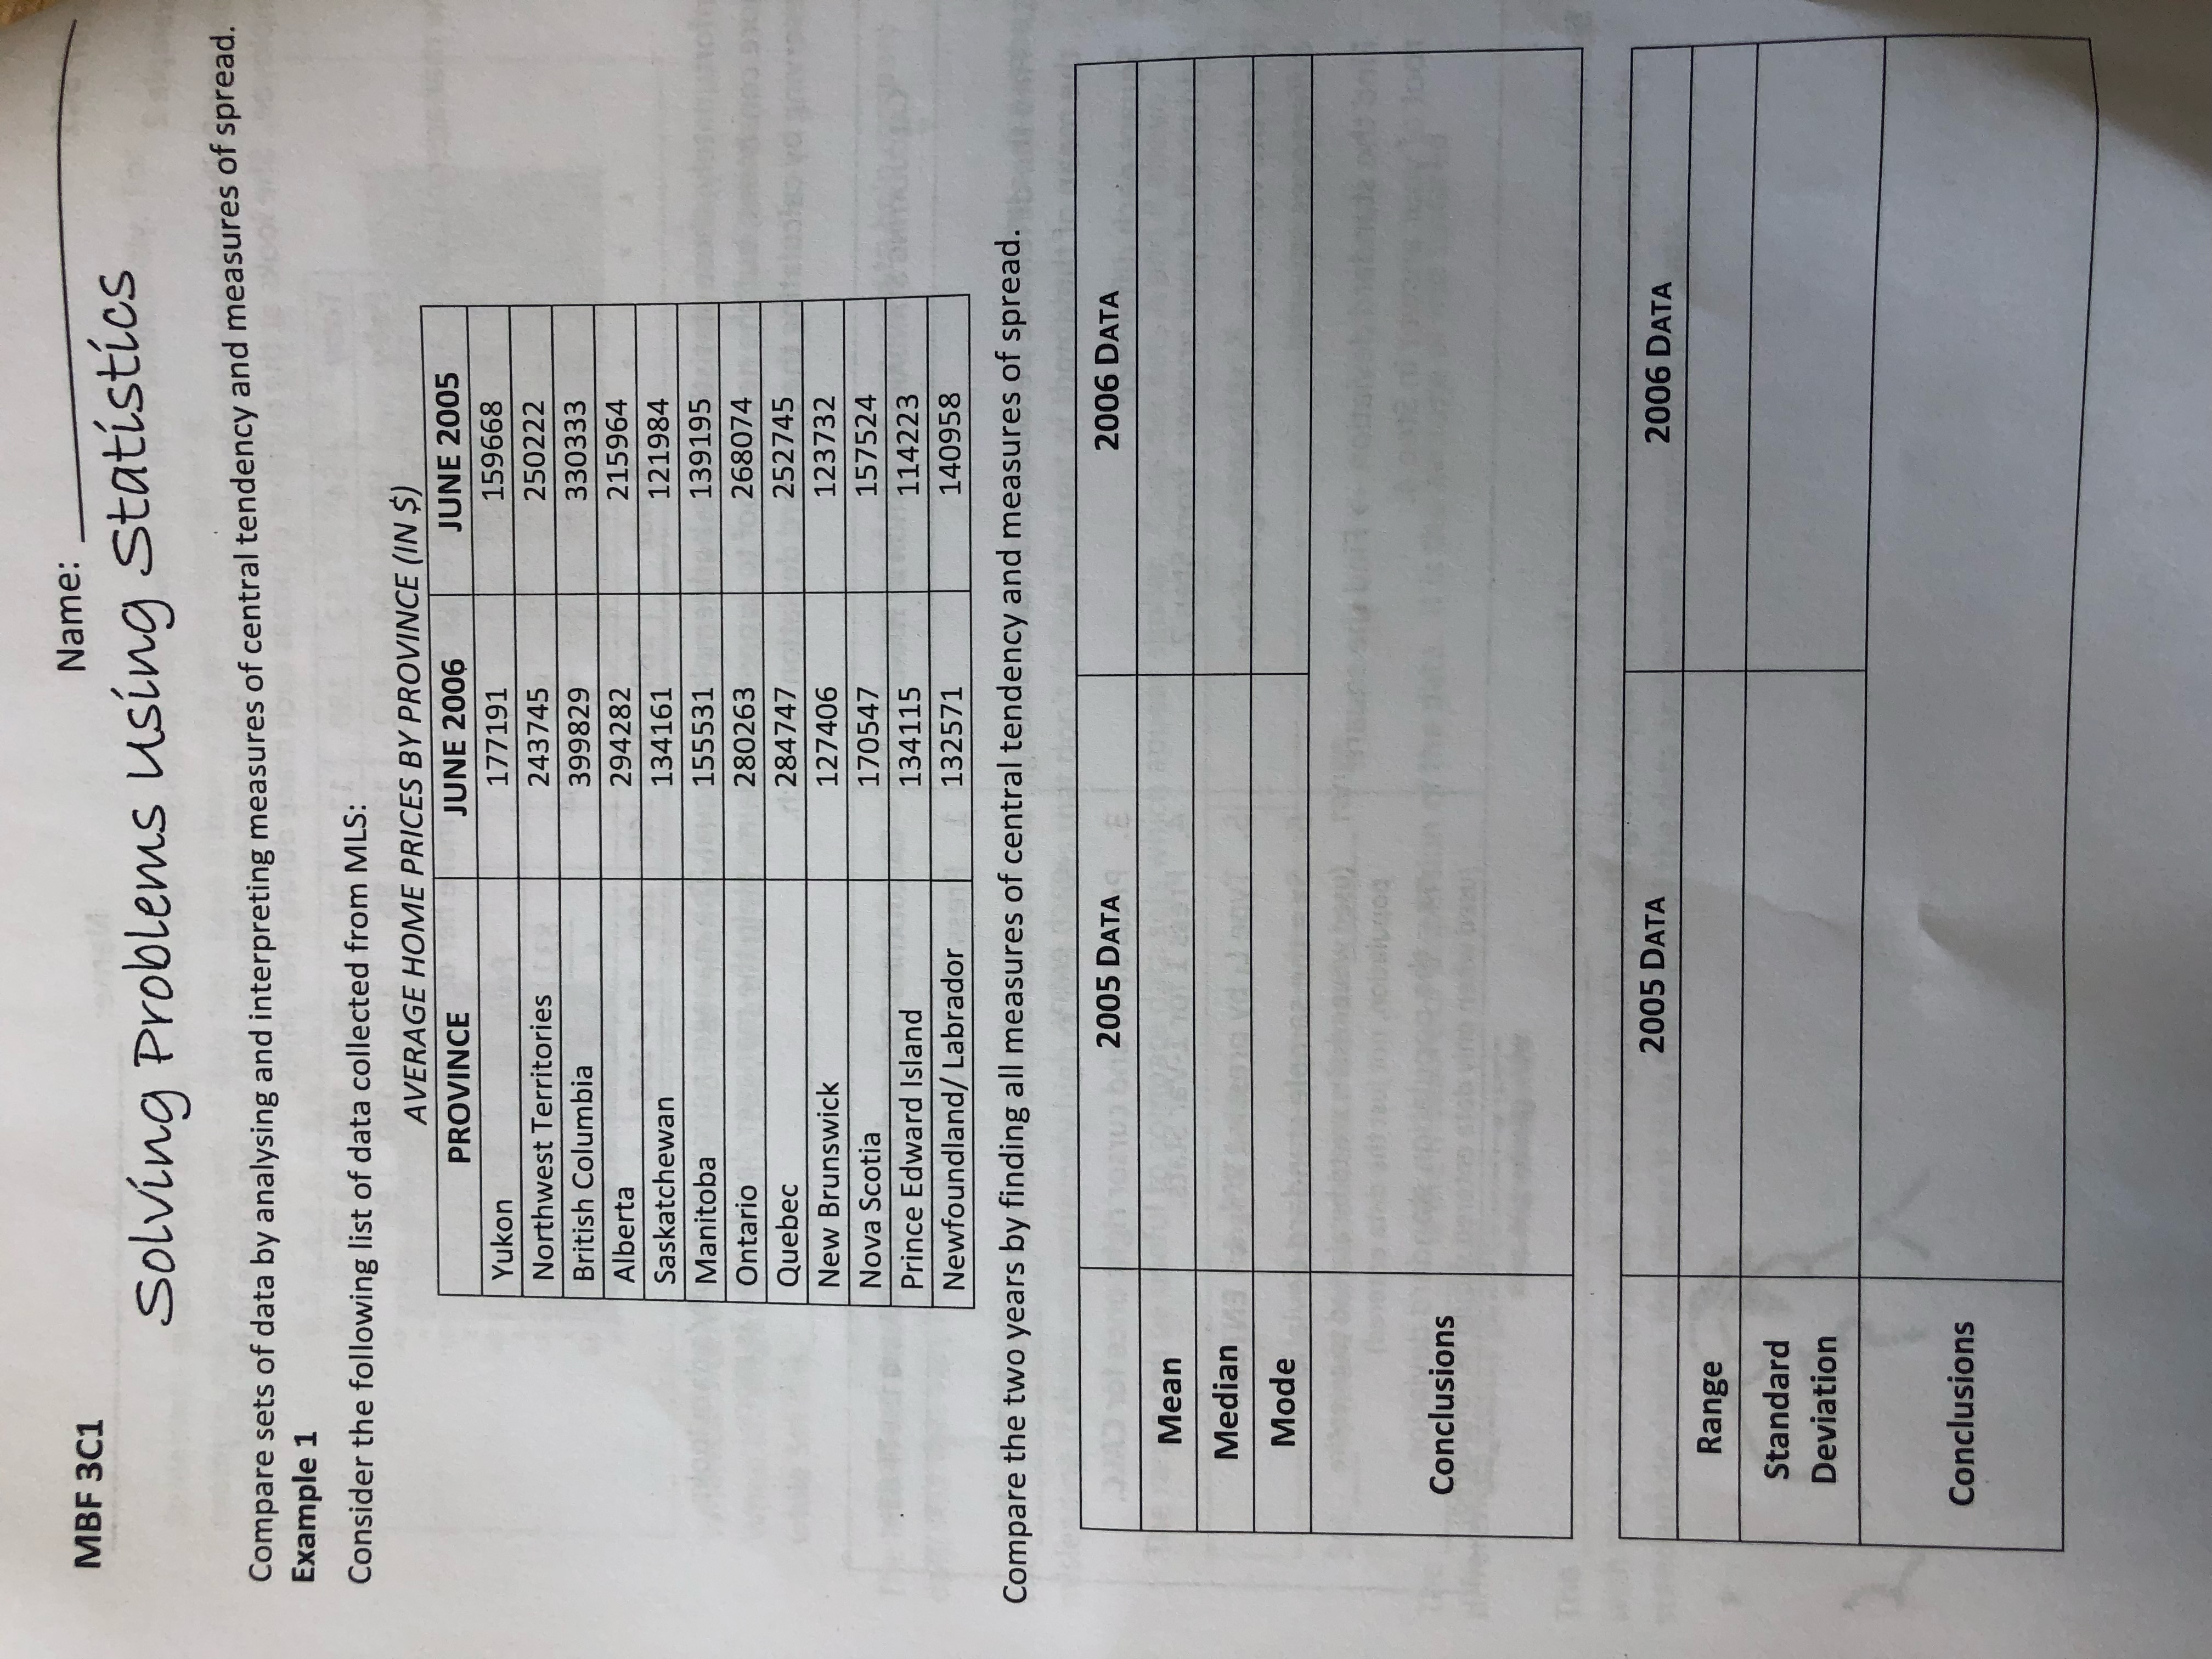

MBF 3C1 Name: Solving Problems using statistics Compare sets of data by analysing and interpreting measures of central tendency and measures of spread. Example 1 Consider the following list of data collected from MLS: AVERAGE HOME PRICES BY PROVINCE (IN $) PROVINCE JUNE 2006 JUNE 2005 Yukon 177191 159668 Northwest Territories 243745 250222 British Columbia 399829 330333 Alberta 294282 215964 Saskatchewan 134161 121984 Manitoba 155531 139195 Ontario 280263 268074 Quebec 284747 252745 New Brunswick 127406 123732 Nova Scotia 170547 157524 Prince Edward Island 134115 114223 Newfoundland/ Labrador 132571 140958 Compare the two years by finding all measures of central tendency and measures of spread. 2005 DATA 2006 DATA Mean Median Mode Conclusions 2005 DATA 2006 DATA Range Standard Deviation Conclusions
Step by Step Solution
There are 3 Steps involved in it

Get step-by-step solutions from verified subject matter experts