

Question: MENG 332 Control System T=2 a=1 b=2 c=3 d=8 just send the maltlab for this nstructions: For the given system below, - Design a PID
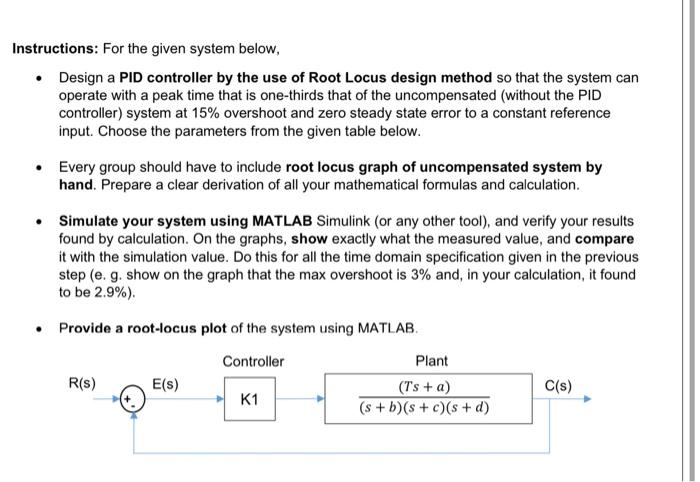
nstructions: For the given system below, - Design a PID controller by the use of Root Locus design method so that the system can operate with a peak time that is one-thirds that of the uncompensated (without the PID controller) system at 15% overshoot and zero steady state error to a constant reference input. Choose the parameters from the given table below. - Every group should have to include root locus graph of uncompensated system by hand. Prepare a clear derivation of all your mathematical formulas and calculation. - Simulate your system using MATLAB Simulink (or any other tool), and verify your results found by calculation. On the graphs, show exactly what the measured value, and compare it with the simulation value. Do this for all the time domain specification given in the previous step (e. g. show on the graph that the max overshoot is 3% and, in your calculation, it found to be 2.9% ). - Provide a root-locus plot of the system using MATLAB. nstructions: For the given system below, - Design a PID controller by the use of Root Locus design method so that the system can operate with a peak time that is one-thirds that of the uncompensated (without the PID controller) system at 15% overshoot and zero steady state error to a constant reference input. Choose the parameters from the given table below. - Every group should have to include root locus graph of uncompensated system by hand. Prepare a clear derivation of all your mathematical formulas and calculation. - Simulate your system using MATLAB Simulink (or any other tool), and verify your results found by calculation. On the graphs, show exactly what the measured value, and compare it with the simulation value. Do this for all the time domain specification given in the previous step (e. g. show on the graph that the max overshoot is 3% and, in your calculation, it found to be 2.9% ). - Provide a root-locus plot of the system using MATLAB
Step by Step Solution
There are 3 Steps involved in it

Get step-by-step solutions from verified subject matter experts