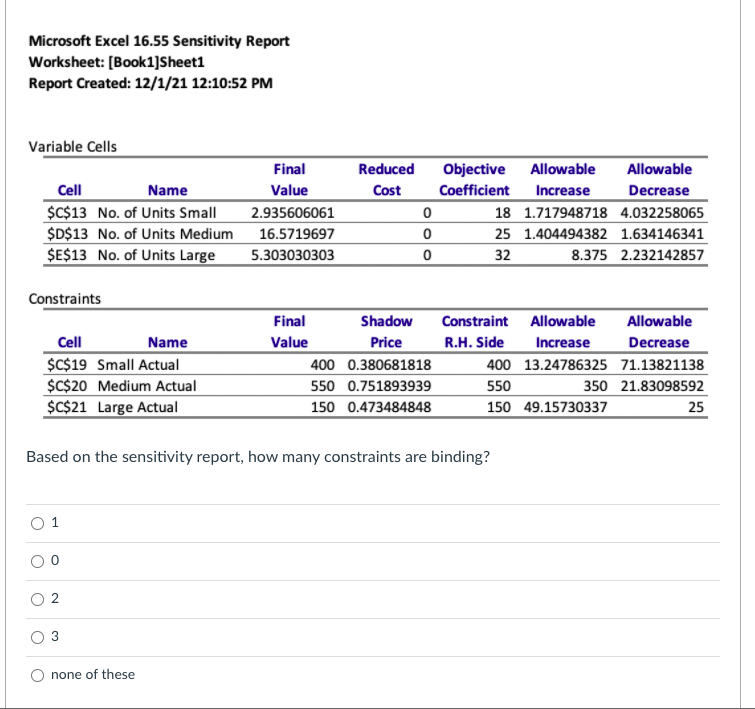
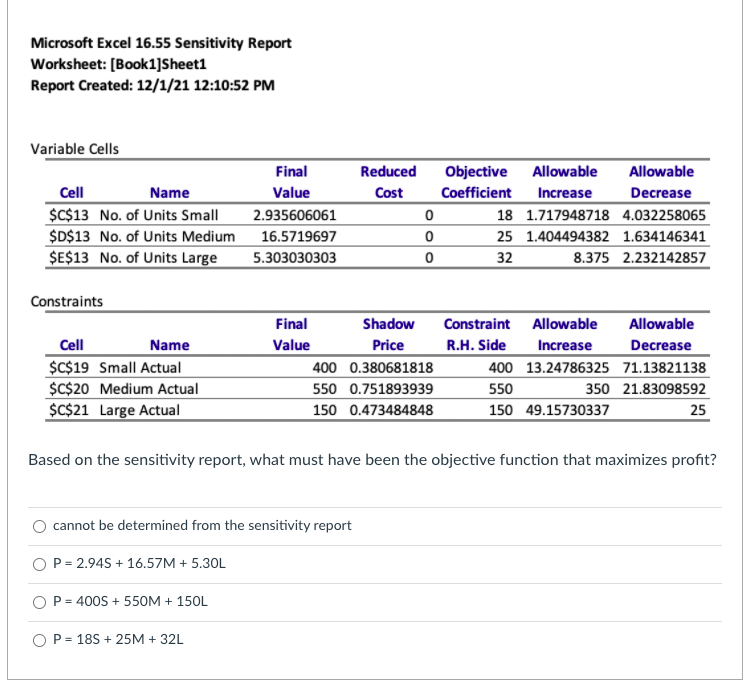
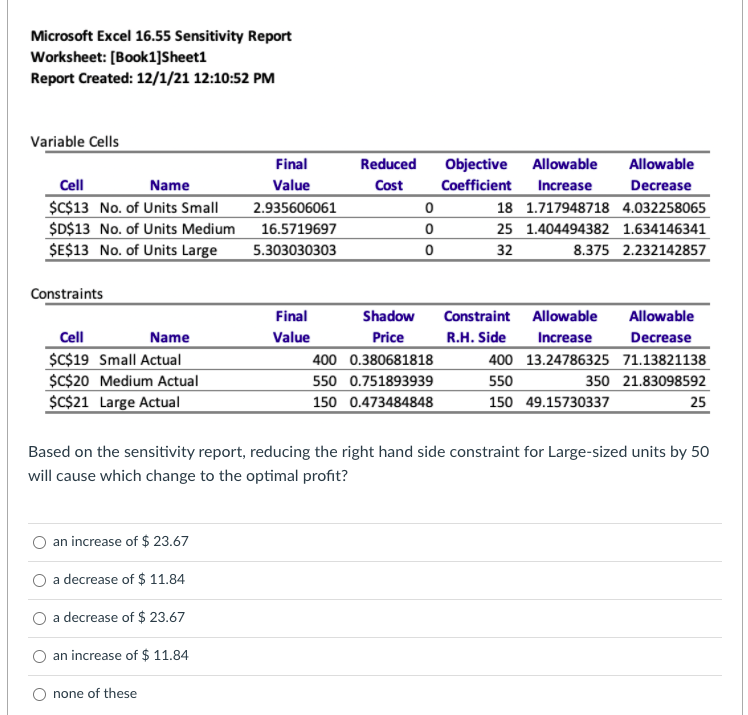
Question: Microsoft Excel 16.55 Sensitivity Report Worksheet: [Book 1]Sheet1 Report Created: 12/1/21 12:10:52 PM Variable Cells Cell Name $C$13 No. of Units Small $D$13 No. of

Microsoft Excel 16.55 Sensitivity Report

Microsoft Excel 16.55 Sensitivity Report

Microsoft Excel 16.55 Sensitivity Report

Microsoft Excel 16.55 Sensitivity Report Worksheet: [Book 1]Sheet1 Report Created: 12/1/21 12:10:52 PM Variable Cells Cell Name $C$13 No. of Units Small $D$13 No. of Units Medium $E$13 No. of Units Large Final Value 2.935606061 16.5719697 5.303030303 Reduced Cost 0 0 0 Objective Allowable Allowable Coefficient Increase Decrease 18 1.717948718 4.032258065 25 1.404494382 1.634146341 32 8.375 2.232142857 Constraints Cell Name $C$19 Small Actual $C$20 Medium Actual $C$21 Large Actual Final Shadow Value Price 400 0.380681818 550 0.751893939 150 0.473484848 Constraint Allowable Allowable R.H. Side Increase Decrease 400 13.24786325 71.13821138 550 350 21.83098592 150 49.15730337 25 Based on the sensitivity report, how many constraints are binding? 0 1 0 O 0 N 2 none of these Microsoft Excel 16.55 Sensitivity Report Worksheet: [Book 1]Sheet1 Report Created: 12/1/21 12:10:52 PM Variable Cells Reduced Cost Cell Name $C$13 No. of Units Small $D$13 No. of Units Medium $E$13 No. of Units Large Final Value 2.935606061 16.5719697 5.303030303 0 0 0 Objective Allowable Allowable Coefficient Increase Decrease 18 1.717948718 4.032258065 25 1.404494382 1.634146341 32 8.375 2.232142857 Constraints Cell Name $C$19 Small Actual $C$20 Medium Actual $C$21 Large Actual Final Shadow Value Price 400 0.380681818 550 0.751893939 150 0.473484848 Constraint Allowable Allowable R.H. Side Increase Decrease 400 13.24786325 71.13821138 550 350 21.83098592 150 49.15730337 25 Based on the sensitivity report, what must have been the objective function that maximizes profit? cannot be determined from the sensitivity report OP = 2.945 + 16.57M + 5.30L OP = 400S + 550M + 150L OP = 185 + 25M + 32L Microsoft Excel 16.55 Sensitivity Report Worksheet: [Book1]Sheet1 Report Created: 12/1/21 12:10:52 PM Variable Cells Cell Name $C$13 No. of Units Small $D$13 No. of Units Medium $E$13 No. of Units Large Final Value 2.935606061 16.5719697 5.303030303 Reduced Cost 0 o 0 Objective Allowable Allowable Coefficient Increase Decrease 18 1.717948718 4.032258065 25 1.404494382 1.634146341 32 8.375 2.232142857 Constraints Cell Name $C$19 Small Actual $C$20 Medium Actual $C$21 Large Actual Final Shadow Value Price 400 0.380681818 550 0.751893939 150 0.473484848 Constraint Allowable Allowable R.H. Side Increase Decrease 400 13.24786325 71.13821138 550 350 21.83098592 150 49.15730337 25 Based on the sensitivity report, reducing the right hand side constraint for Large-sized units by 50 will cause which change to the optimal profit? an increase of $ 23.67 a decrease of $ 11.84 a decrease of $ 23.67 an increase of $ 11.84 none of these

Step by Step Solution

There are 3 Steps involved in it

1 Expert Approved Answer
Step: 1 Unlock blur-text-image
Question Has Been Solved by an Expert!

Get step-by-step solutions from verified subject matter experts

Step: 2 Unlock
Step: 3 Unlock

Students Have Also Explored These Related General Management Questions!