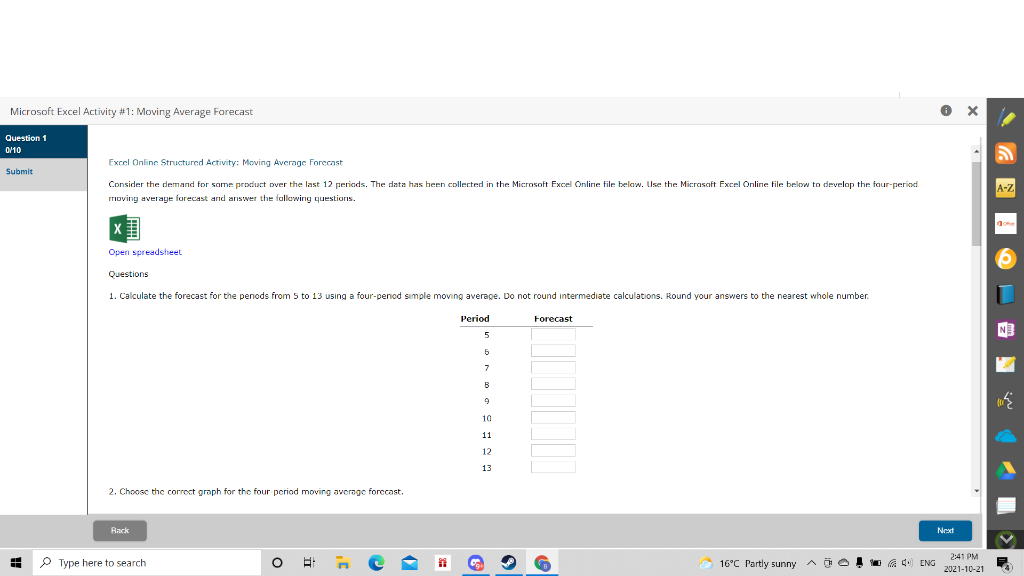
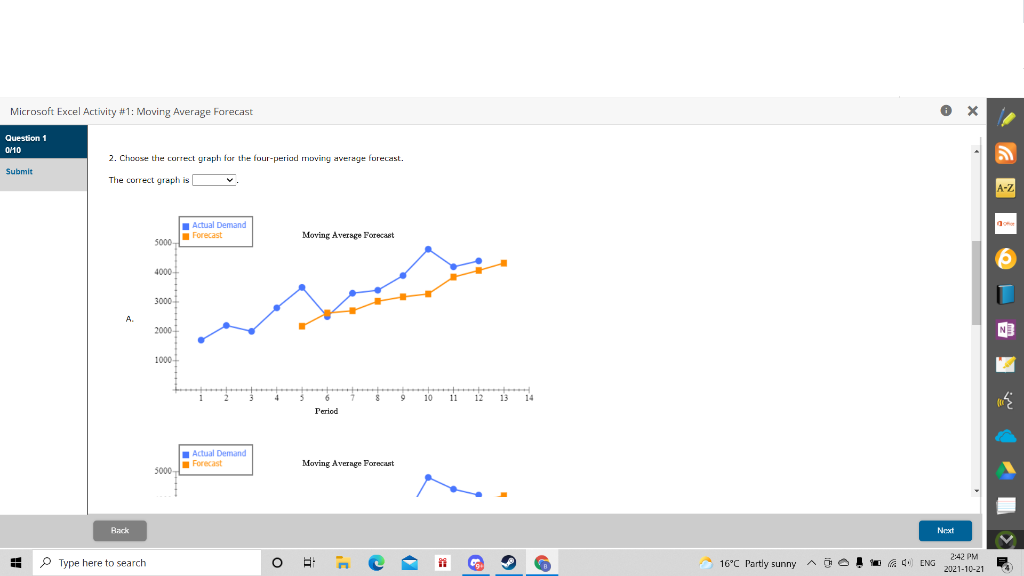
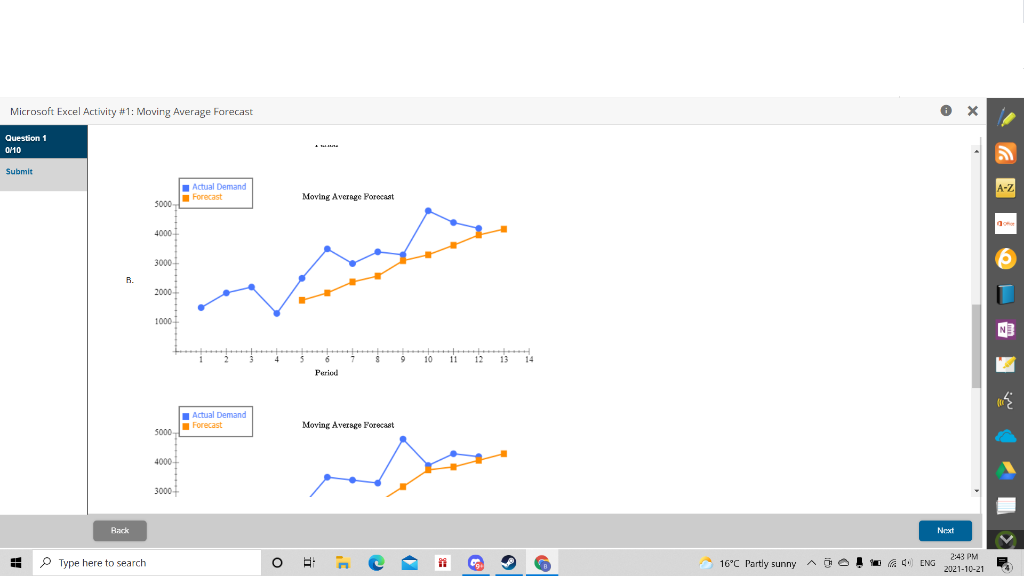
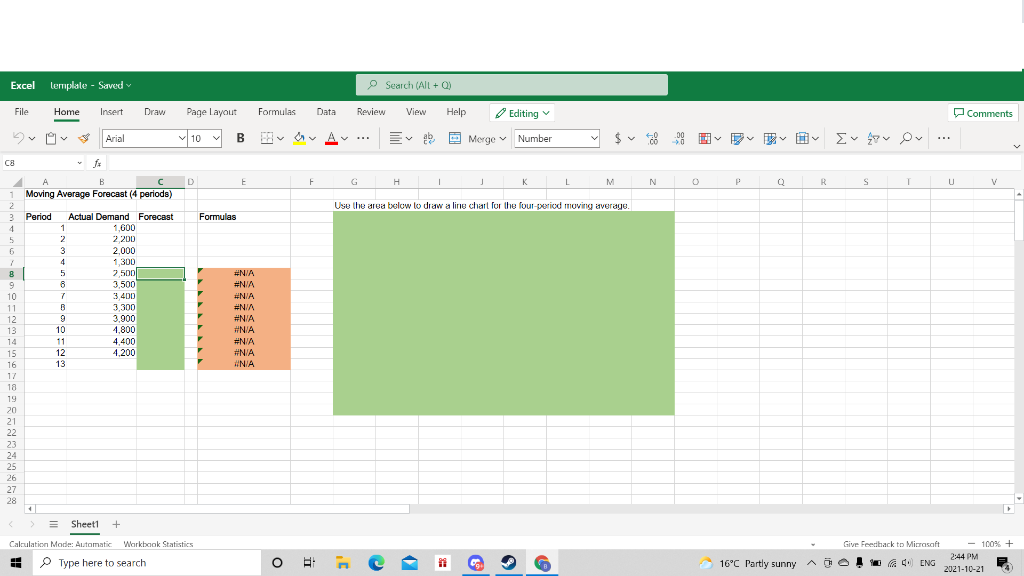
Question: Microsoft Excel Activity #1: Moving Average Forecast X Question 1 0/10 Excel Online Structured Activity: Moving Average Forecast Submit Consider the demand for same product

Microsoft Excel Activity #1: Moving AverageMicrosoft Excel Activity #1: Moving AverageMicrosoft Excel Activity #1: Moving AverageMicrosoft Excel Activity #1: Moving AverageMicrosoft Excel Activity #1: Moving Average

Microsoft Excel Activity #1: Moving Average Forecast X Question 1 0/10 Excel Online Structured Activity: Moving Average Forecast Submit Consider the demand for same product over the last 12 periods. The data has been collected in the Microsoft Excel Online file below. Use the Microsoft Excel Online file below to develop the four-period moving average forecast and answer the following questions. Open Spreadsheet Questions 1. Calculate the forecast for the periods from 5 to 13 using a four-penod simple moving average. Do not round intermediate calculations. Round your answers to the nearest whole number. Period Forecast 5 6 B 10 11 12 13 2. Choose the correct graph for the four period moving average forecast. Rack Next Type here to search O 16C Partly sunny T! ENG 2:41 PM 2021-10-21 Microsoft Excel Activity #1: Moving Average Forecast 0 X Question 1 010 2. Choose the correct graph for the four-period moving average forecast. Submit The correct graph is Actual Demand Forecast Moving Average Forecast 5000 4000 3000 A 2000 1000 10 11 12 13 14 Period Actual Demand Forecast Moving Average Foreca 5000 Back Next 1 Type here to search O 16C Partly sunny T! ENG 2:42 PM 2021-10-21 Microsoft Excel Activity #1: Moving Average Forecast X Question 1 0/10 Submit Actual Demand Forecast Moving Average Parocant 5000 4000 3000 R. 2000 VA 1000 9 10 11 12 13 14 Period Actual Demand 5000 Forecast Moving Average Forecast 4000 3000 Back Next 1 Type here to search O 16C Partly sunny T! ENG 2:43 PM 2021-10-21 Microsoft Excel Activity #1: Moving Average Forecast X Question 1 0/10 Actual Demand Forecast Moving Average Forecast 5000 Submit 4000 3000 C 2000 1000 9 10 11 12 13 Period Actual Demand Forecast Moving Average Forecast 5000 4000 3000 D. 2000 Back Next 1 Type here to search 16C Partly sunny T! ENG 2:43 PM 2021-10-21 Excel lemplate - Saved - Search (All + Q) File Home Home Insert Draw Page Layout Formulas Data Review View Help Editing Comments v $ Arial 10 B V V abe Merge Number $vo v OE O... Evo V C8 D E F G H j K M N N P Q R S T U v v B Moving Average Forecast (4 periods) - Use the area blow to draw a line chart for the four-period moving average. 1 2 3 4 5 Formulas Period Actual Demand Forecast 1 1,600 2 2 2 200 3 2,000 4 1,300 5 2.500 3.500 7 3 400 B 3300 9 3,900 10 4,800 11 4.400 12 4,200 13 #NIA #N/A #N/A #NIA #N/A #N/A #N/A #N/A WNIA 8 9 10 11 12 13 14 15 16 17 18 19 20 21 22 23 24 25 26 27 28 1 = Sheet1 + Calculation Mode: Automatic Workbook Statistics Type here to search Give Feedback to Mirasoft - 100% + 2:44 PM 16C Partly sunny ANO ENG 4. 2021-10-21 O

Step by Step Solution

There are 3 Steps involved in it

1 Expert Approved Answer
Step: 1 Unlock blur-text-image
Question Has Been Solved by an Expert!

Get step-by-step solutions from verified subject matter experts

Step: 2 Unlock
Step: 3 Unlock

Students Have Also Explored These Related General Management Questions!