

Question: MKT 364 - Operations Management Case #2 - Forecasting Background Read the Southwestern University (B) case on Page 152 of the textbooks. Solution Requirements Utilize
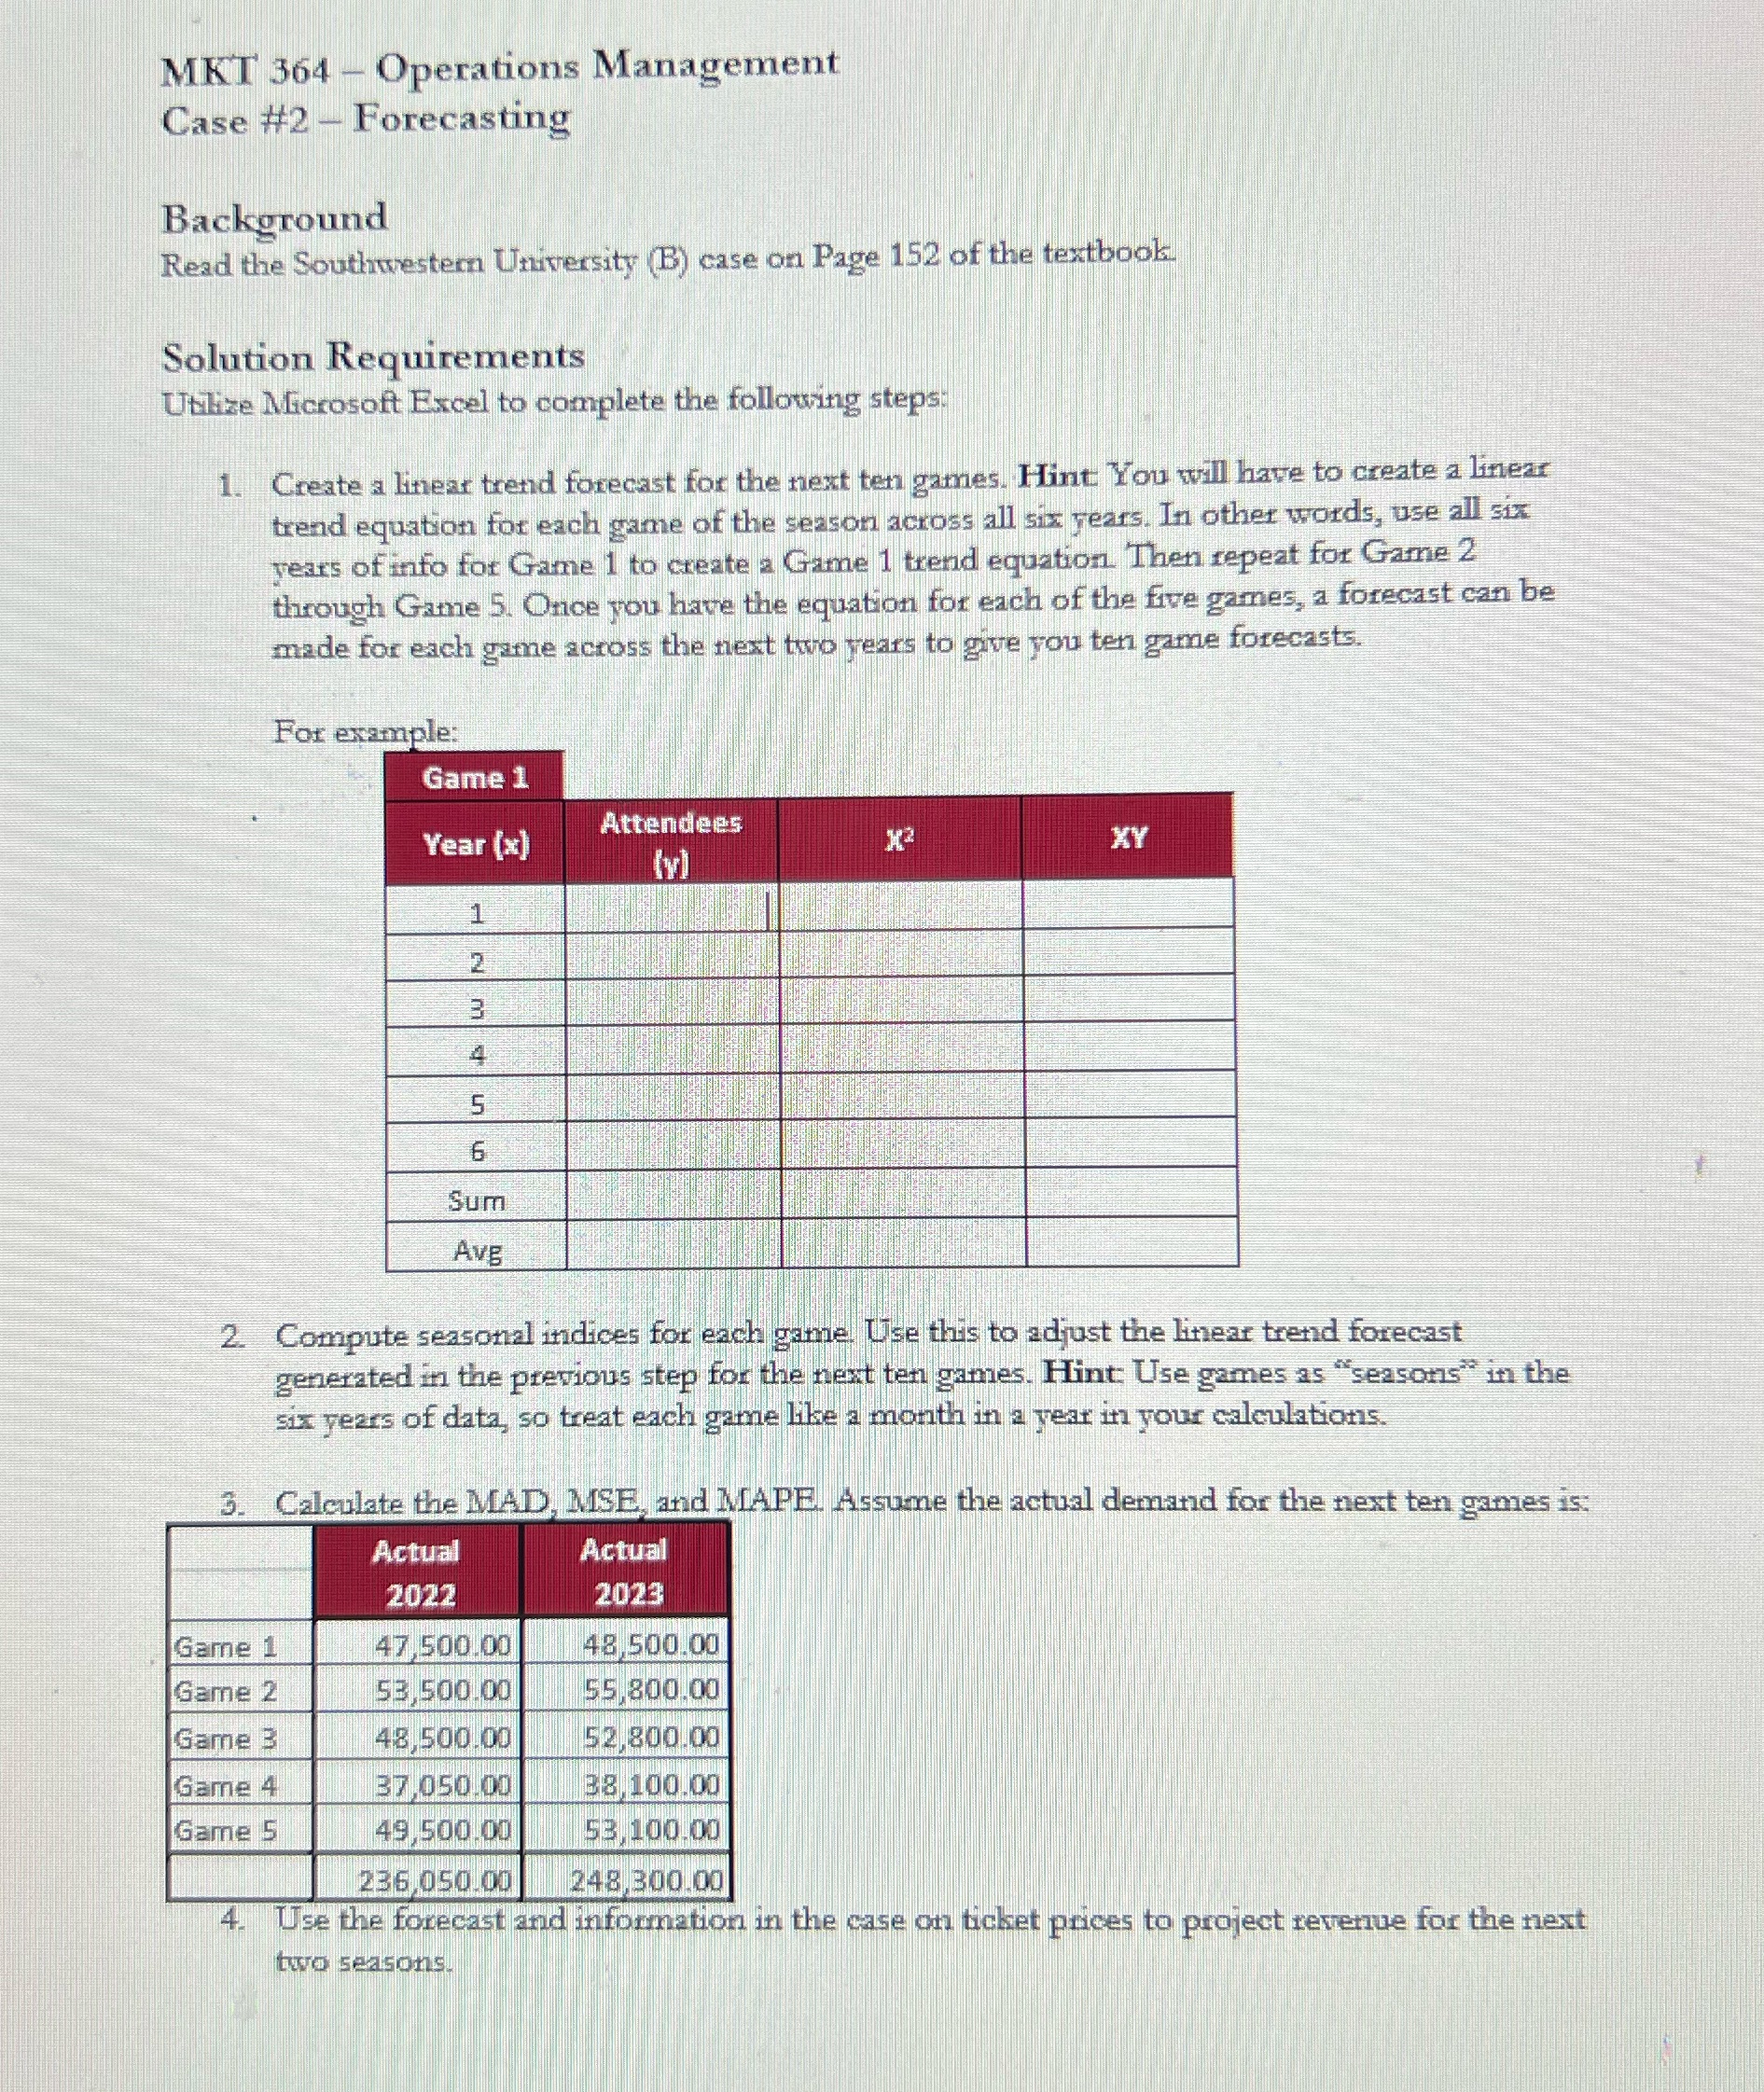
MKT 364 - Operations Management Case #2 - Forecasting Background Read the Southwestern University (B) case on Page 152 of the textbooks. Solution Requirements Utilize Microsoft Excel to complete the following steps: 1. Create a linear trend forecast for the next ten games. Hint You will have to create a linear trend equation for each game of the season across all six years. In other words, use all six years of info for Game 1 to create a Game 1 trend equation. Then repeat for Game 2 through Game 5. Once you have the equation for each of the five games, a forecast can be made for each game across the next two years to give you ten game forecasts. For example: Game 1 Year (x) Attendees X2 XY (v) 2 3 5 6 Sum AVE 2. Compute seasonal indices for each game. Use this to adjust the linear trend forecast generated in the previous step for the next ten games. Hint: Use games as "seasons" in the six years of data, so treat each game like a month in a year in your calculations. 3. Calculate the MAD, MSE, and MAPE. Assume the actual demand for the next ten games is: Actual Actual 2022 2023 Game 1 47,500.00 43,500.00 Game 2 53,500.00 55,800.00 Game 3 48,500.00 52,800.00 Game 4 37,050.00 38 100.00 Game 5 49,500.00 53,100.00 236,050.00 248,300.00 4. Use the forecast and information in the case on ticket prices to project revenue for the next two seasons
Step by Step Solution
There are 3 Steps involved in it

Get step-by-step solutions from verified subject matter experts