

Question: Model Summary Adjusted R Std. Error of Model R R Square Square the Estimate 1 .336a .113 .094 8.89383 a. Predictors: (Constant), GDP per capita
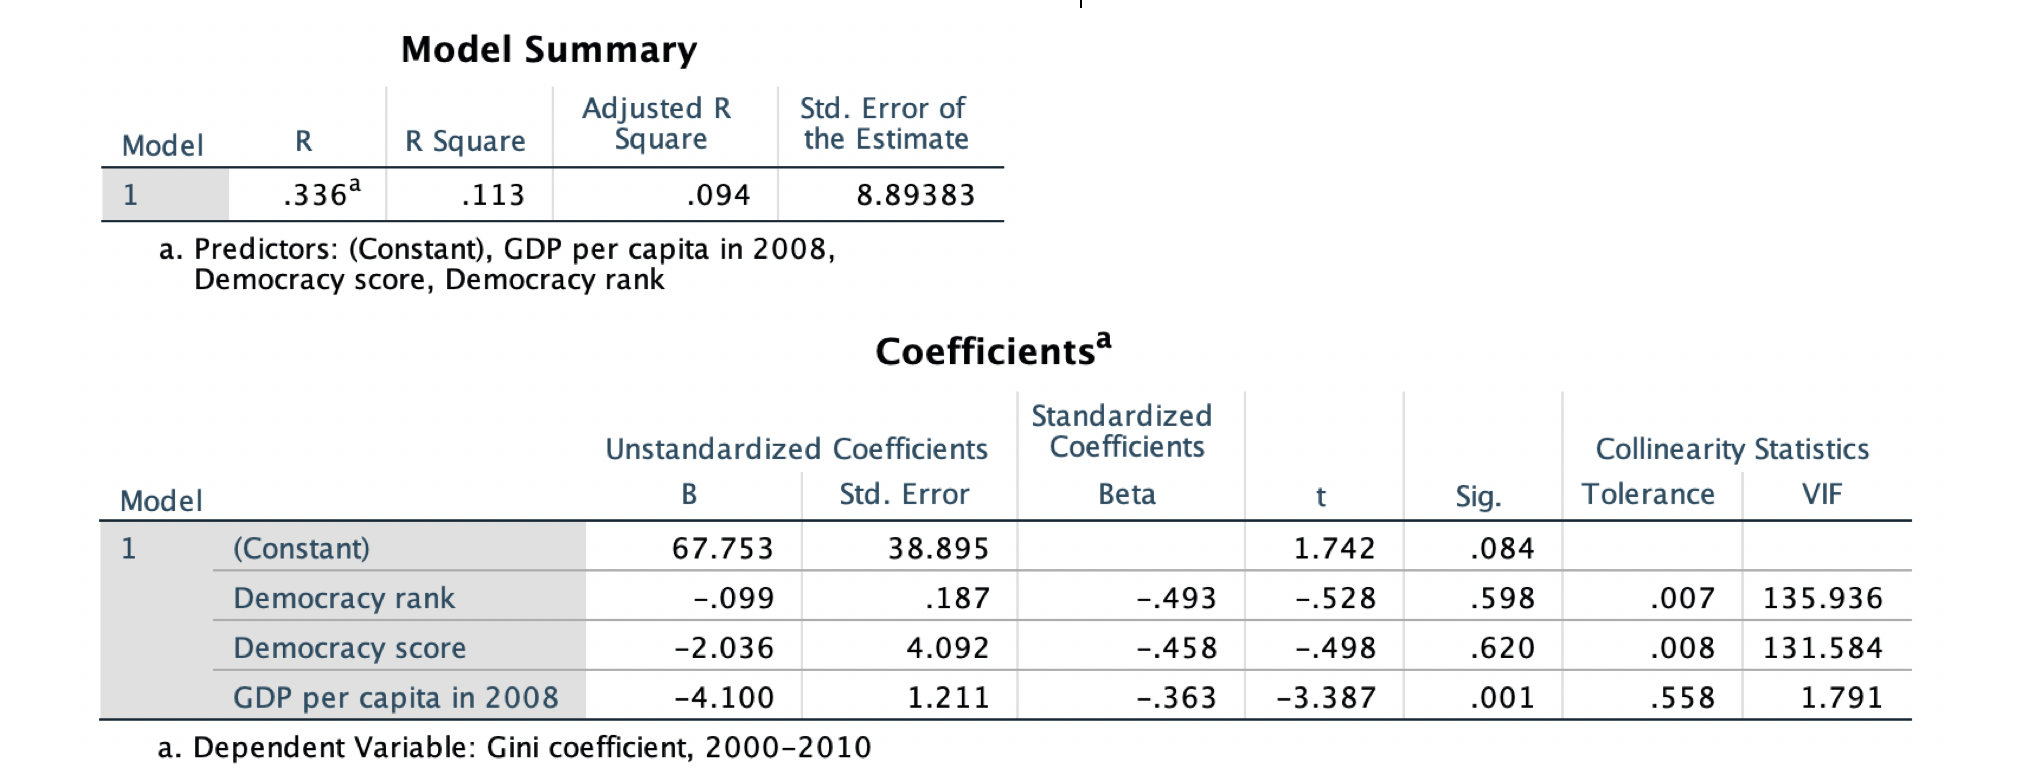
Model Summary Adjusted R Std. Error of Model R R Square Square the Estimate 1 .336a .113 .094 8.89383 a. Predictors: (Constant), GDP per capita in 2008, Democracy score, Democracy rank Coefficientsa Standardized Unstandardized Coefficients Coefficients Collinearity Statistics Model B Std. Error Beta t Sig. Tolerance VIF 1 (Constant) 67.753 38.895 1.742 084 Democracy rank -.099 187 -.493 -.528 598 007 135.936 Democracy score -2.036 4.092 -.458 -.498 .620 008 131.584 GDP per capita in 2008 -4.100 1.211 -.363 -3.387 001 558 1.791 a. Dependent Variable: Gini coefficient, 2000-2010
Step by Step Solution
There are 3 Steps involved in it
1 Expert Approved Answer
Step: 1 Unlock

Question Has Been Solved by an Expert!
Get step-by-step solutions from verified subject matter experts
Step: 2 Unlock
Step: 3 Unlock