

Question: MS Excel Work Create Data Table Create column names in A1, Bi, Ci, and Di, as described in the image below In Column A, create

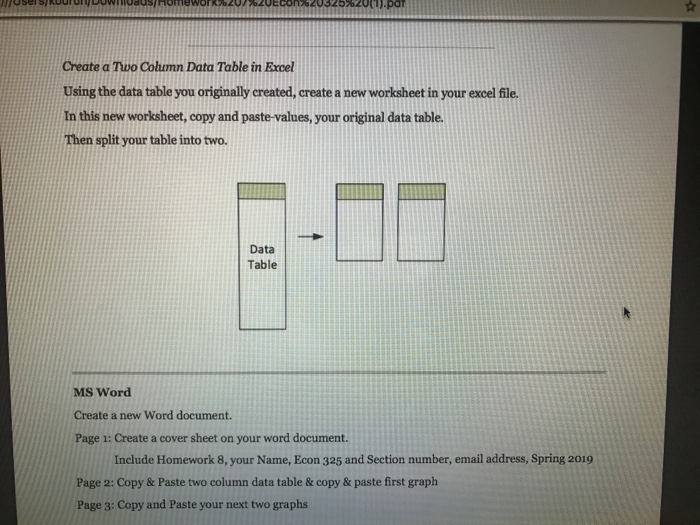
MS Excel Work Create Data Table Create column names in A1, Bi, Ci, and Di, as described in the image below In Column A, create a column with values of .The values start at-2and increase by 0.1 and end at 3. You should have 51 values of x. In Column B, create a column with values of logodds, where logodds-1-2x. You will need to use am Excel formula to create the logodds value based on x values. In Column C, create a column with the values of odds. Use an Excel formula using logodds values. In Column D, create a column of the probability. Use a formula and use the odds column 11- logodds l Odds | Prob 31.9 is i -2 5 148.4132 0.993307 4.8 121.5104 0.99183 4.6 99.48432 0.990048 41.8 -1.7 | 4.4 181.45087 10.9878721 Example of some values Create Graphs in Excel Create three scatter plots 1. X-axis is x and y-axis is logodds 2. X-axis is x and y-axis is odds 3. X-axis is x and y-axis is Prob If necessary, adjust the range of the x-axis values be from -2 to 3 for all three graphs. Page 1 of a2 Create a Two Column Data Table in Excel Using the data table you originally created, create a new worksheet in your excel file. In this new worksheet, copy and paste-values, your original data table Then split your table into two. Data Table MS Word Create a new Word document Page 1: Create a cover sheet on your word document Include Homework 8, your Name, Econ 325 and Section number, email address, Spring 2019 Page 2: Copy & Paste two column data table & copy & paste first graph Page 3: Copy and Paste your next two graphs
Step by Step Solution
There are 3 Steps involved in it

Get step-by-step solutions from verified subject matter experts