

Question: my answer says its not complete can someone please help me find whats missing ? I mostly need help with the FIFO AND LIFO please
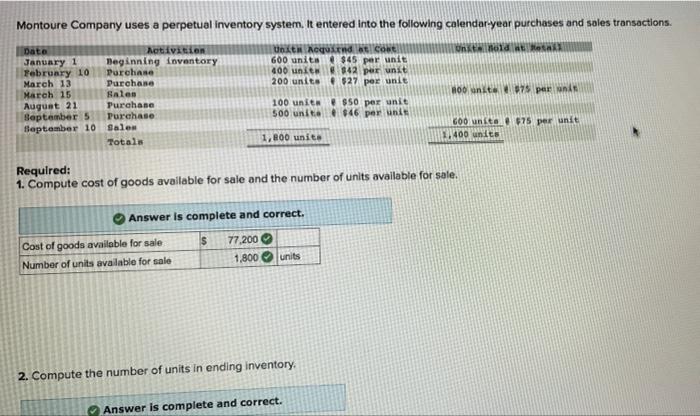
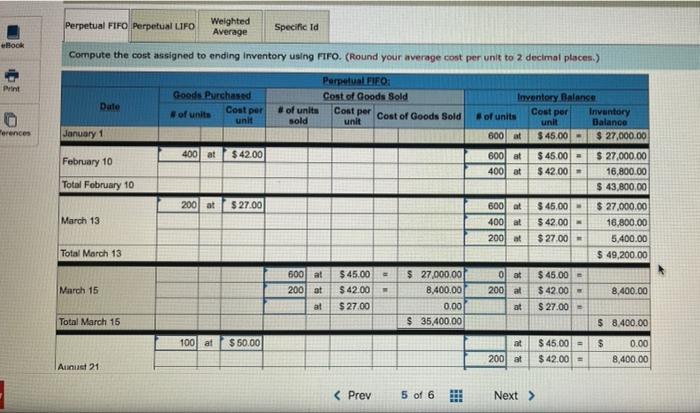
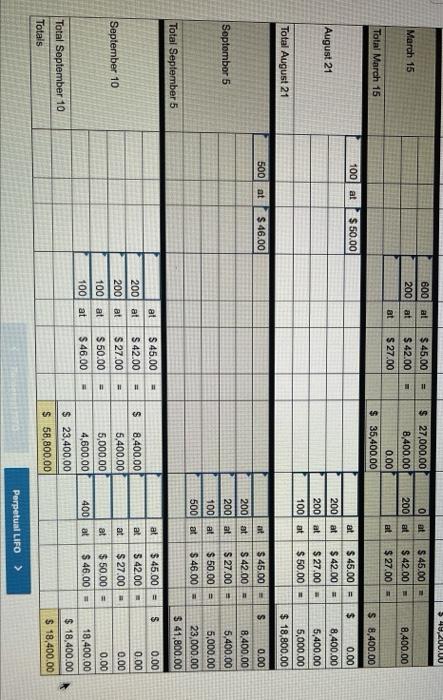
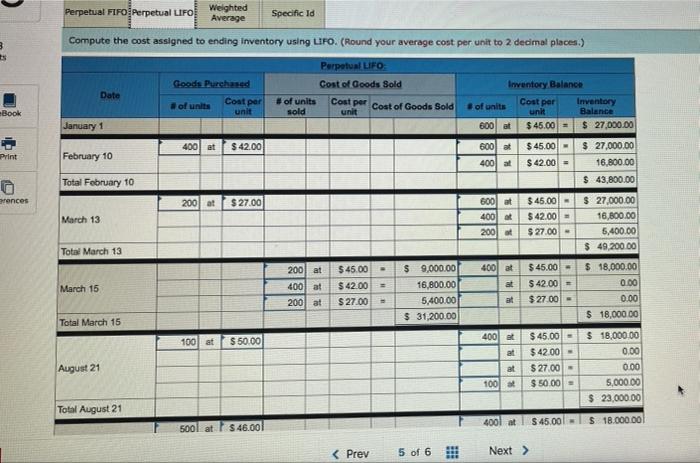
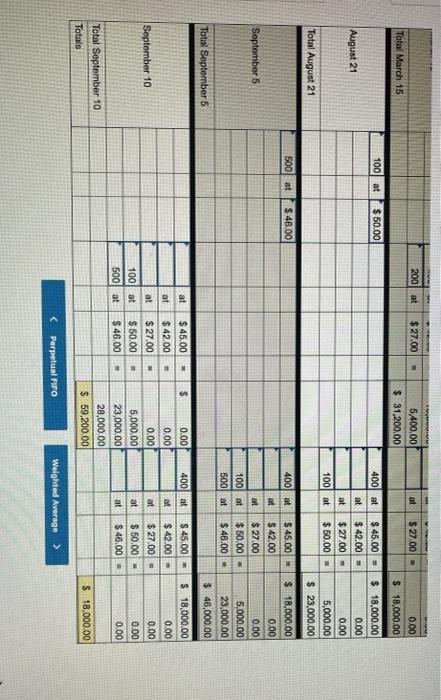
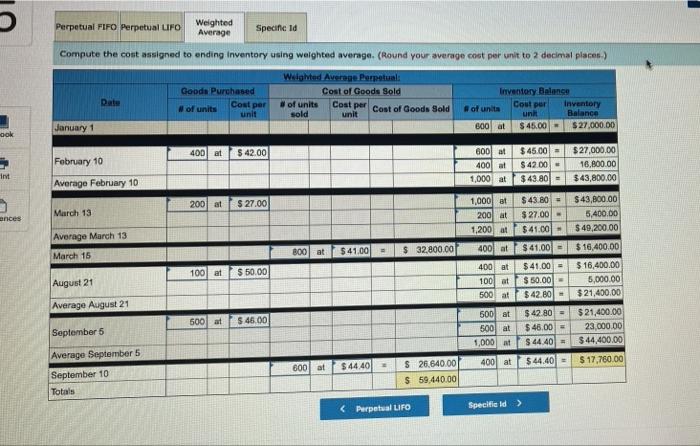
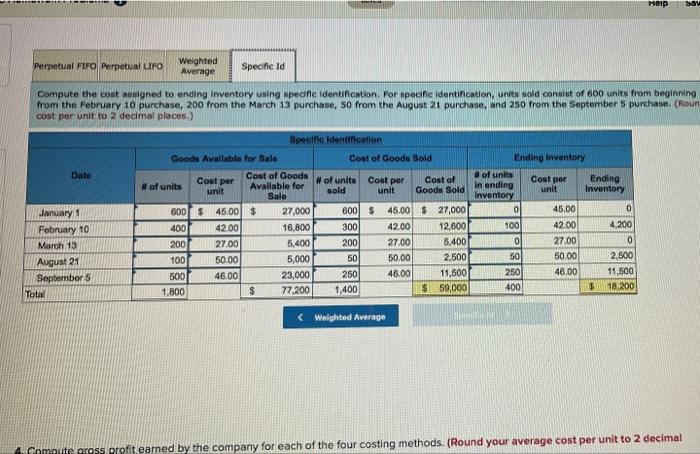
Montoure Company uses a perpetual inventory system. It entered into the following calendar year purchases and sales transactions. Unktioni Unit Acquind tot 600 units $45 per unit 400 units $42 per unit 200 unito $27 per unit Date January 1 February 10 March 13 March 15 August 21 September 5 September 10 no unite 75 per Motivation Beginning inventory Purchase Purchase Sales Purchase Purchase Sales Totals 100 units $50 per unit 500 unito 46 per uns GOO unita75 per unit 1.400 units 1,800 unite Required: 1. Compute cost of goods available for sale and the number of units available for sale. Answer is complete and correct. Cost of goods available for sale $ 77,200 Number of units available for sale 1,800 units 2. Compute the number of units in ending inventory Answer is complete and correct. Perpetual FIFO Perpetual LIFO Weighted Average Specific Id Book Compute the cost assigned to ending Inventory using Firo. (Round your average cost per unit to 2 decimal places.) Date Goods Purchased Cost per of units unt Perpetual FIFO: Cost of Goods Sold Cost per Cost of Goods Sold unit of units sold Inventory Balanse Cost per of units Inventory unit Balance 600 at $ 45.00 $ 27,000.00 erences January 1 400 at $ 42.00 February 10 600 at 400 at $ 45,00 - $ 42.00 Total February 10 200 at $ 27.00 600 at 400 al $ 27,000.00 16,800.00 $ 43,800,00 $ 27,000.00 16,800.00 5,400.00 $ 49,200.00 $ 45,00 $ 42.00 $ 27.00 March 13 2001 at Total March 13 - 600 at 200 at at $ 45.00 $42.00 $ 27.00 : March 15 ol at 200 at $ 27,000.00 8,400.00 0.00 $ 35,400.00 $ 45.00 $ 42.00 - $ 27.00 8,400.00 at Total March 15 $ 8.400.00 100 at $50.00 $ $45.00 $42.00 0.00 8,400.00 2001 at Aunust 21 $ 49,200.00 = 600 at 2001 at March 15 $ 45.00 $42.00 $ 27.00 0 at 200 at 1 $ 27,000.00 8,400.00 0.00 $ 35,400.00 $ 45.00 $ 42.00 $ 27.00 = 8.400.00 at at Total March 15 $ 8,400.00 100 at $50.00 August 21 at 2001 at 2001 at 1001 at $ 45.00 = $42.00 $ 27.00 - $50,00 $ 0.00 8,400.00 5,400.00 5,000.00 $ 18,800.00 Total August 21 500 at $ 46.00 S at 200 at September 5 200 at 100 at 500) at $45.00 - $ 42.00 = $ 27.00 = $50.00 = $ 46.00 = 0.00 8,400.00 5,400.00 5,000.00 23,000.00 $ 41,800.00 Total September 5 $ at al = at 2001 at 2001 at 100 at 100 at $ 45.00 $ 42.00 $ 27.00 $50.00 $ 46.00 at September 10 $45.00 = $ 42.00 = $ 27.00 = $ 50.00 = $ 46.00 = 3 $ 8.400.00 5,400.00 5,000.00 4,600.00 $ 23,400,00 $ 58,800.00 at 0.00 0.00 0.00 0.00 18,400.00 $ 18,400.00 $ 18,400.00 = 400 at Total September 10 Totals Perpetual LIFO > Perpetual FIFO Perpetual LIFO Weighted Average Specific Id Compute the cost assigned to ending inventory using LIFO. (Round your average cost per unit to 2 decimal places.) Perpetual LIFO Date Goods Purchased Coat par of units unit Cost of Goods Sold # of units Cost per cost of Goods Sold unit Inventory Balance of units Cost per Inventory unit Balance 600 af $ 45.00 = $ 27,000.00 Book sold January 1 400 at $42.00 600 at Print February 10 $ 45.00 $ 42.00 = 400 at $ 27,000.00 16,800.00 $ 43,800.00 Total February 10 rences 2001 at $ 27.00 March 13 600 at 400 a 200 of $45.00 $42.00 $ 27.00 - $ 27,000.00 16,800.00 5,400.00 $ 49,200.00 Total March 13 . 400 at 200 at 400 at 200 at mt March 15 $45.00 $42.00 $ 27.00 at $ 9,000.00 16,800.00 5,400.00 $ 31,200.00 $45.00 - $ 42.00 = $ 27.00 $ 18,000.00 0.00 0.00 $ 18,000.00 at Total March 15 $50.00 100 at 4001 et at $ 45,00 - $42.00 - $ 27.00 - $50.00 - August 21 at $ 18,000.00 0.00 0.00 5,000.00 $ 23,000.00 100 Total August 21 $ 45.00 400l at $18.000.00! $ 46.001 500l at 200 at $27.00 of $27.00 - Total March 15 5,400.00 $ 31,200.00 0.00 $ 18,000.00 1001 at $ 50.00 400 at at August 21 $ 45.00 - $ 42.00 = $ 27.00 - $50.00 - at 1001 at $ 18,000.00 0.00 0.00 5,000.00 $ 23,000.00 Total August 21 500 at $ 46.00 400 at September 5 at $ 45.00 $42.00 $ 27.00 $ 50.00 $ 46,00 $ 18,000.00 0.00 0.00 5,000.00 23,000.00 $ 46,000.00 100 st 500 at Total September at $ 4001 at at at 0.00 0.00 0.00 $ 45.00 $42.00 $ 27.00 $ 50.00 $ 46.00 at September 10 ot $ 45,00 - $42.00 - $27.00 - $50.00 - $ 46.00 $ 18,000.00 0.00 0.00 0.00 0.00 at 100 at 500 at at 5,000.00 23,000.00 28,000.00 $ 59,200.00 Total September 10 Totals $ 18,000.00 Perpetual FIFO Perpetual UFO Weighted Average Specific id Compute the cost assigned to ending Inventory using weighted average. (Round your average cost per unit to 2 decimal places) Weighted Average Perpetual: Cost of Goods Sold of units Cost per cost of Goods Sold sold unit Goods Purchased # of units unit Date Cost per Inventory Balance Hof unita Cout per Inventory un Balance 600 at $ 45,00 - $ 27,000.00 January 1 ook 400 at $42.00 February 10 6001 at 400 at 1,000 at $ 45,00 - $42.00 $43.80- $27,000.00 16,800.00 $43,800.00 int Average February 10 200 at $ 27.00 March 13 ences 1,000 t 200at 1,200 at Average March 13 $41.00 $ 32,800.00 $43.80 - $ 27.00 - $41.00 $ 41.00 $41.00 = $ 50.00 $42.80 800 at 400 at $43,800.00 5,400.00 $ 49,200.00 $ 16,400.00 $ 16,400.00 5,000.00 $21,400.00 March 15 400 at 100 at $50.00 August 21 100 at 500 at Average August 21 500 at $ 46.00 500 at 500 at 1,000 t September 5 $42.80 - $ 45,00 - $ 44.40 = $21,400.00 23,000.00 $44,400.00 400 at $44.40 $ 17,760.00 $44.40 Average September 5 September 10 Totais 800 at $ 26,640.00 $ 59,440.00 Meip Perpetual FIFO Perpetual LIFO Weighted Average Specific Id Compute the cost osigned to ending Inventory using specific identification. For specific identification, units old consist of 600 units from beginning from the February 10 purchase, 200 from the March 13 purchase, 50 from the August 21 purchase, and 250 from the September Spurchase. (Roun cost per unit to 2 decimal places.) Date Cost per January 1 February 10 March 13 August 21 September 5 Total Speelfie Identification Goods Available for Sale Cost of Goods Sold Cost of Goods of units Available for # of units Cost per Cost of unit sold unit Goods Sold Sale 600 $ 45.00 $ 27,000 600 $ 45.00 $ 27,000 400 42.00 16,800 300 42.00 12,600 200 27.00 5,400 200 27.00 5.400 100 50.00 5,000 50 50.00 2,500 500 46.00 23,000 250 46.00 11,500 1,800 $ 77,200 1,400 $ 59,000 Ending Inventory of units Cost per Ending In ending unit Inventory Inventory 0 45.00 100 42.00 4,200 0 27,00 0 50 50.00 2,500 250 46.00 11,500 400 18.200
Step by Step Solution
There are 3 Steps involved in it

Get step-by-step solutions from verified subject matter experts