

Question: Name BUSI2305 10.1 & 10.2 : Regression Lab Instructions: Create a scatter plot, find the linear regression equation (line of best fit), determine the correlation,
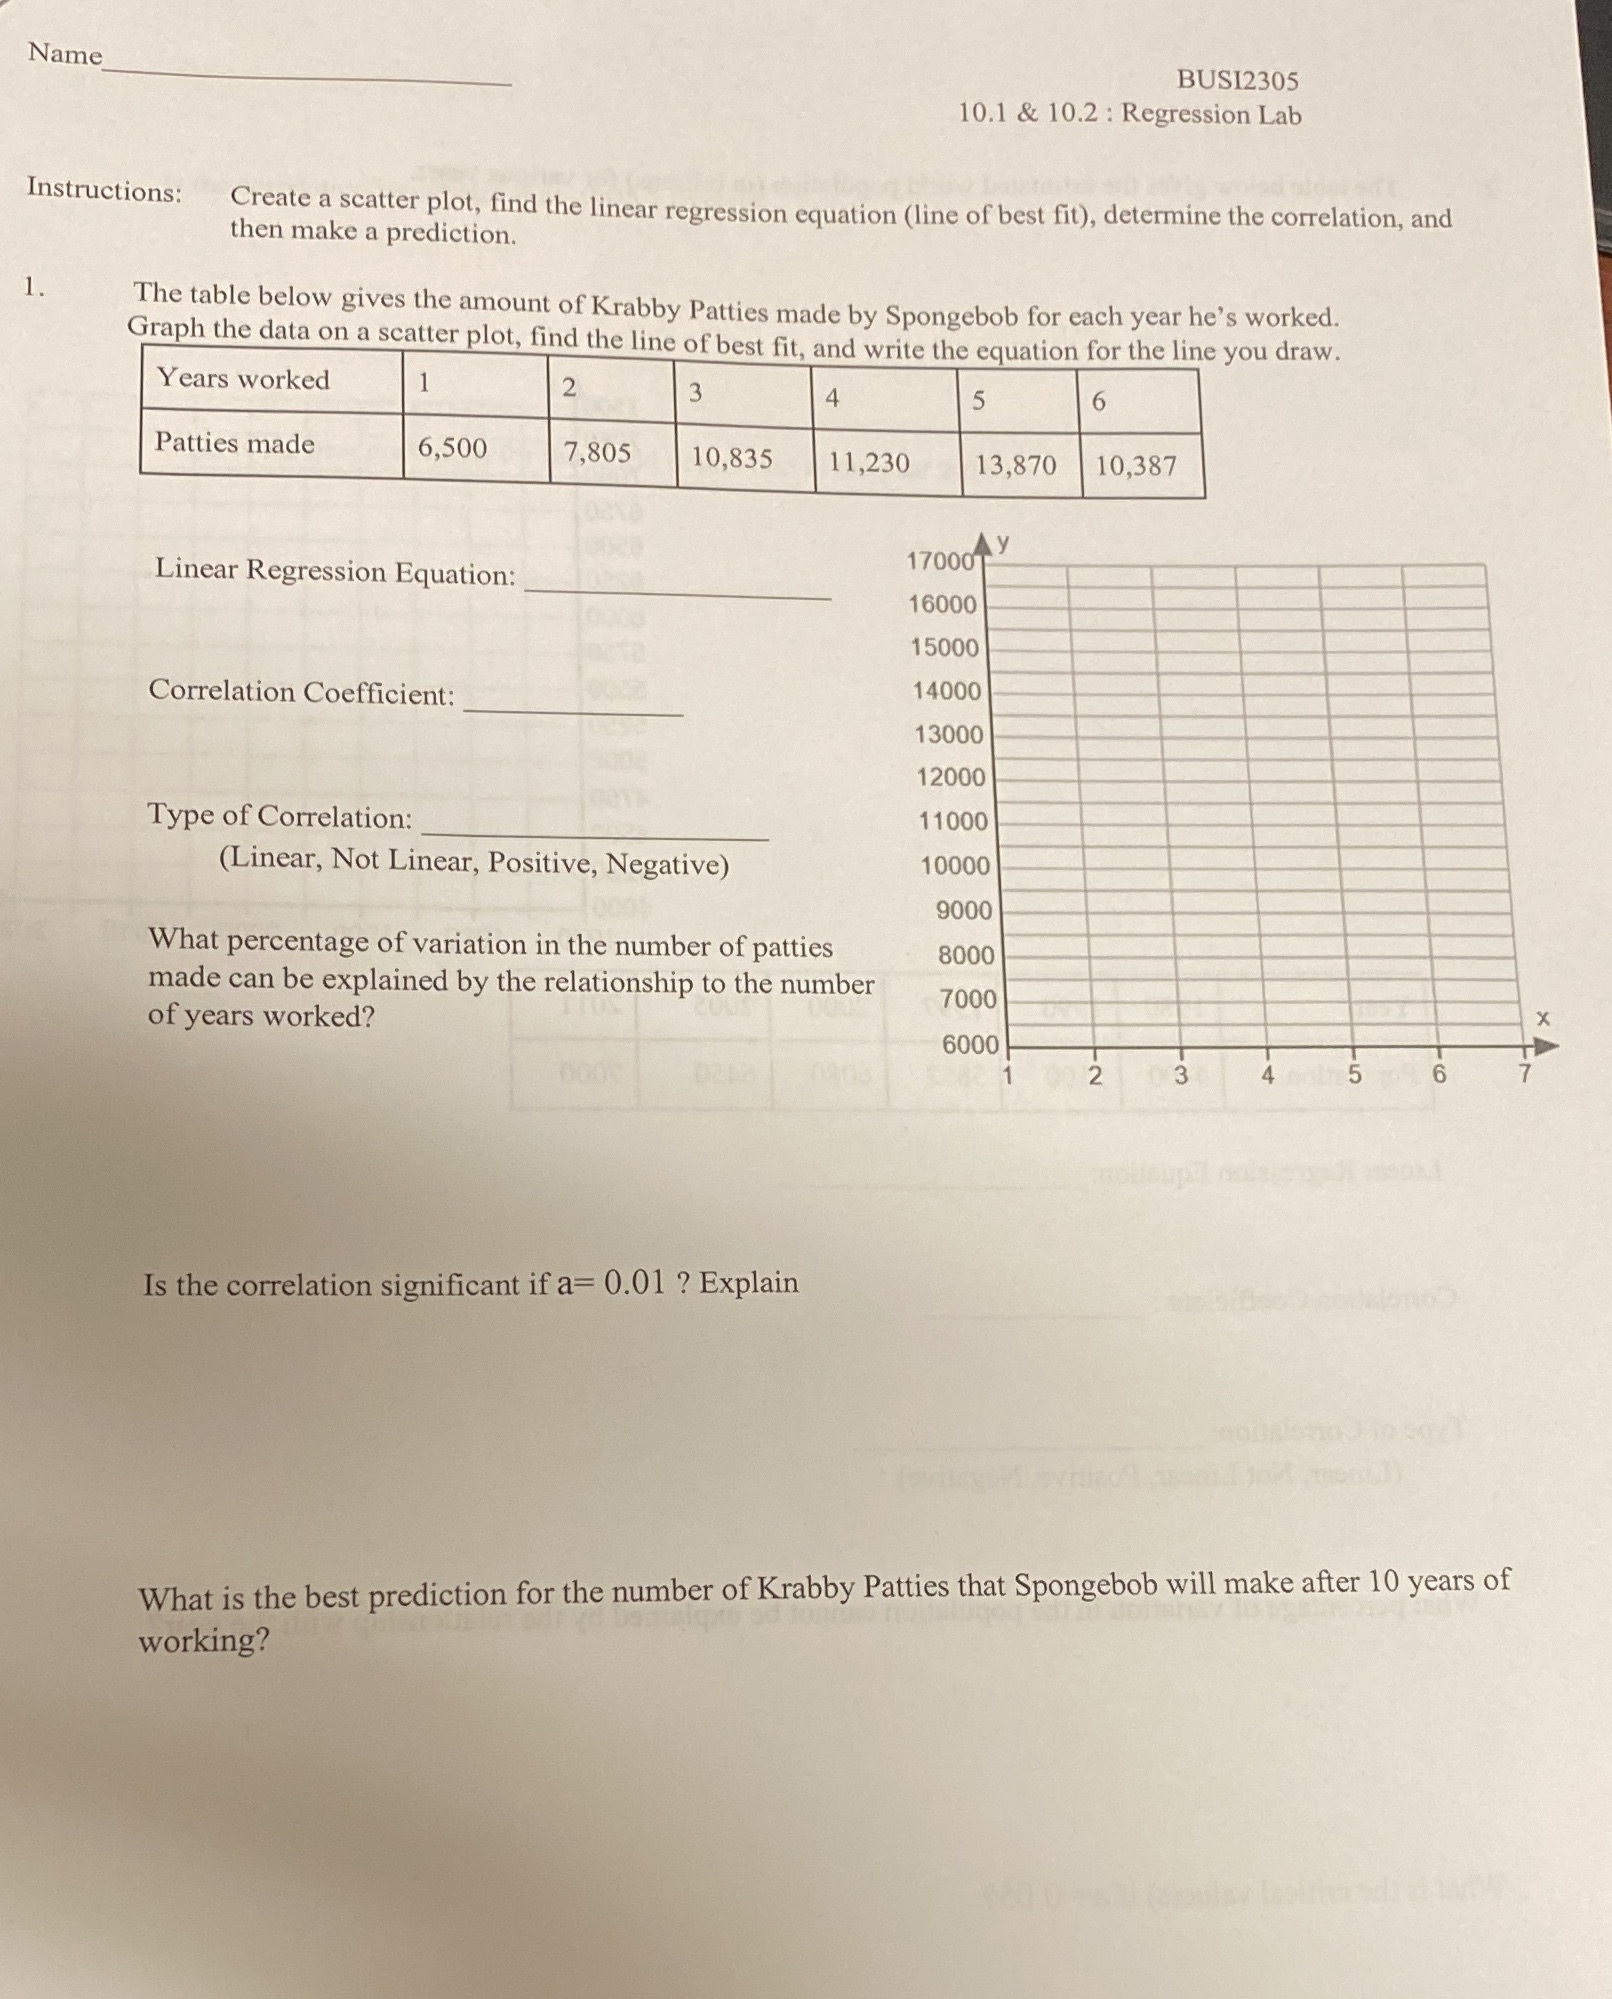
Name BUSI2305 10.1 & 10.2 : Regression Lab Instructions: Create a scatter plot, find the linear regression equation (line of best fit), determine the correlation, and then make a prediction. The table below gives the amount of Krabby Patties made by Spongebob for each year he's worked. Graph the data on a scatter plot, find the line of best fit, and write the equation for the line you draw. Years worked 3 4 5 6 Patties made 6,500 7,805 10,835 11,230 13,870 10,387 Linear Regression Equation: 17000 16000 15000 Correlation Coefficient: 14000 13000 12000 Type of Correlation: 1 1000 (Linear, Not Linear, Positive, Negative) 10000 9000 What percentage of variation in the number of patties 8000 made can be explained by the relationship to the number of years worked? 7000 6000 Is the correlation significant if a= 0.01 ? Explain What is the best prediction for the number of Krabby Patties that Spongebob will make after 10 years of working
Step by Step Solution
There are 3 Steps involved in it

Get step-by-step solutions from verified subject matter experts