

Question: . . necessities study the give records deeply and Drawing conclusions refers to records this is implied or inferred. ... the use of those clues
.
.
necessities study the give records deeply and Drawing conclusions refers to records this is implied or inferred. ... the use of those clues to give for deeper information And provide the details Conclusions
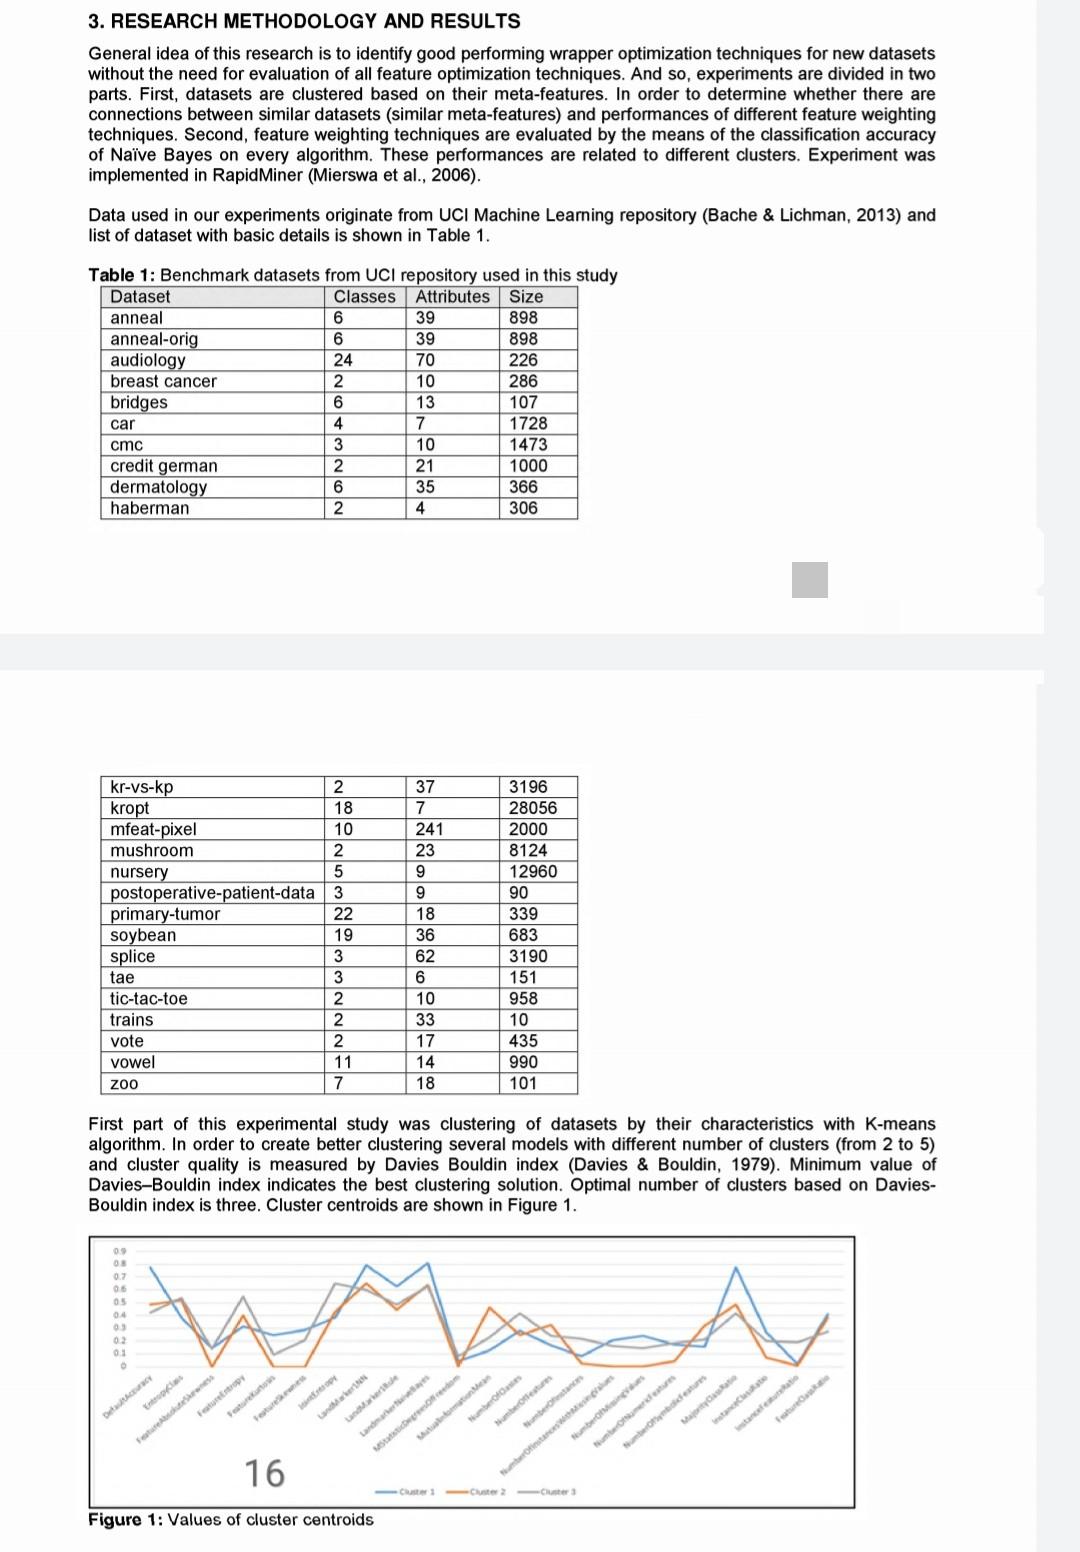
3. RESEARCH METHODOLOGY AND RESULTS General idea of this research is to identify good performing wrapper optimization techniques for new datasets without the need for evaluation of all feature optimization techniques. And so, experiments are divided in two parts. First, datasets are clustered based on their meta-features. In order to determine whether there are connections between similar datasets (similar meta-features) and performances of different feature weighting techniques. Second, feature weighting techniques are evaluated by the means of the classification accuracy of Nave Bayes on every algorithm. These performances are related to different clusters. Experiment was implemented in RapidMiner (Mierswa et al., 2006). Data used in our experiments originate from UCI Machine Learning repository (Bache & Lichman, 2013) and list of dataset with basic details is shown in Table 1. Table 1: Benchmark datasets from UCI repository used in this study Dataset Classes Attributes Size anneal 6 39 898 anneal-orig 6 39 898 audiology 24 70 226 breast cancer 2 10 286 bridges 6 13 107 car 4 7 1728 cmc 10 1473 credit german 21 1000 dermatology 35 366 haberman 4 306 MoM | kr-vs-kp kropt mfeat-pixel mushroom nursery postoperative-patient-data primary-tumor soybean splice tae tic-tac-toe trains vote vowel ZOO 2 18 10 2 5 3 22 19 3 3 2 2 2 11 7 37 7 241 23 9 9 18 36 62 6 10 33 17 14 18 3196 28056 2000 8124 12960 90 339 683 3190 151 958 10 435 990 101 First part of this experimental study was clustering of datasets by their characteristics with K-means algorithm. In order to create better clustering several models with different number of clusters (from 2 to 5) and cluster quality is measured by Davies Bouldin index (Davies & Bouldin, 1979). Minimum value of Davies-Bouldin index indicates the best clustering solution. Optimal number of clusters based on Davies- Bouldin index is three. Cluster centroids are shown in Figure 1. 09 03 03 Os 04 v 02 01 De Number be decreation 16 C-Cluster 2 - 3 Figure 1: Values of cluster centroidsStep by Step Solution
There are 3 Steps involved in it
1 Expert Approved Answer
Step: 1 Unlock

Question Has Been Solved by an Expert!
Get step-by-step solutions from verified subject matter experts
Step: 2 Unlock
Step: 3 Unlock