

Question: need a solid explanation for number 6 please w View Help Foxit PDF i - T 5 G Normal 6 B > 4- Use Exponential
need a solid explanation for number 6 please 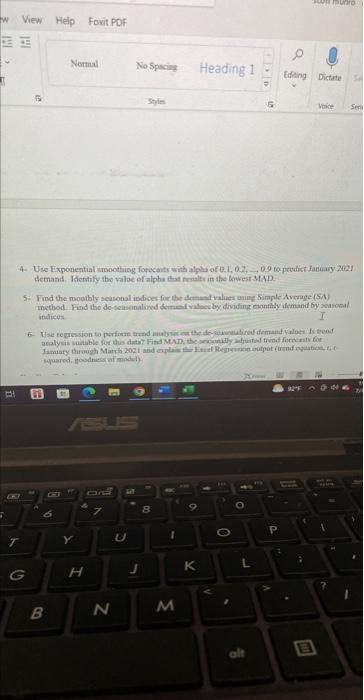
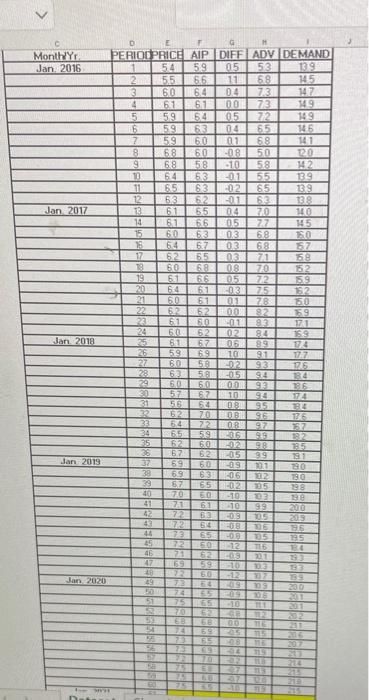
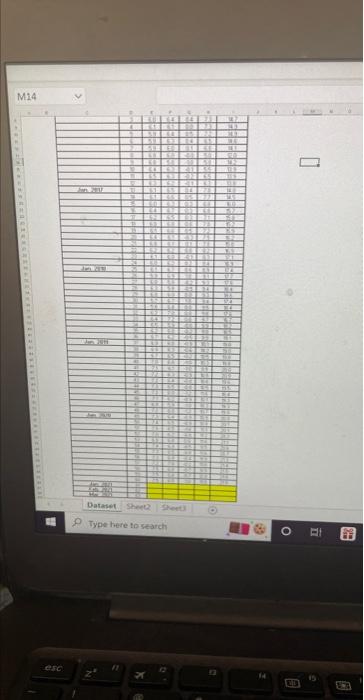
w View Help Foxit PDF i - T 5 G Normal 6 B > 4- Use Exponential smoothing forecasts with alpha of 0.1, 0.2, 0.9 to predict January 2021 demand. Identify the value of alpha that results in the lowest MAD H 5- Find the monthly seasonal indices for the demand values using Simple Average (SA) method. Find the de-seasonalized demand value by dividing monthly demand by seasonal I OFE 6- Use regression to perfors trend analysat on the de-sonalized demand valoes Is trend analysis suitable for this data? Find MAD, the seconally adjusted trend forecast for January through March 2021 and explain the Excel Regreson output (trend equation, squared, goodness of model) N No Spacing N S U J 00 8 1 Heading 1 M 9 K A LOD 0 L alt O V Editing Dictate SA P scon munro 92F . Voice Sem ; 1 A Month Yr Jan. 2016 Jan 2017 Jan 2018 Jan 2019 Jan, 2020 G PERIODPRICE AIP DIFF ADV DEMAND 5.9 0.5 139 HEAR 1 2 3 4 5 6 7 8 9 10 12 13 14 15 15 17 18 19 20 21 22 23 24 26 27 28 29 30 31 33 34 35 36 37 38 39 40 41 42 43 44 45 46 47 48 49 50 51 52 53 54 55 15 43 158 630 54 5.5 6.0 6.1 59 59 59 68 6.8 64 6.5 63 61 99 6.4 60 64 6.7 65 60 -08 58 -10 63 63 62 60 6.1 64 61 61 61 64 63 04 65 60 01 68 -0.1 55 02 65 62 -0.1 63 65 04 70 61 6.6 0.5 7.7 63 0.3 0.3 03 71 08 89 SE 66 02 60 62 61 60 61 5.9 60 63 60 5.7 56 62 70 64 72 65 59 206 62 60 62 60 62 67 69 11 04 7.3 00 73 05 72 73 65 72 71 62 100 58 02 5.8 -0.5 6.0 00 67 10 64 08 08 09 6.0 70 05 72 03 75 01 78 H 80 12 82 01 83 2017 60 -10 53 6.8 02 84 06 10 91 93 50 5.8 -12 68 602 89 67 62 -05 69 60 -09 10.1 50 6.9 631 -06 102 67 65 1-02 105 70 103 71 6.1 -10 99 72 63 -0.9 10.5 64 -08 106 -0.9 105 68 94 93 94 95 96 97 9.9 66 -12 116 -09 201 59 59 -10 10.3 72 6.0 107 73 103 74 09 1018 -10 TL1 48 112 00 116 115 98 66 65 65 62 68 68 74 69 65 73 208 116 73 49 04 119 70 -02 110 72 75 75 75 315 14.5 14.7 149 14.9 14.6 14.1 120 14.2 139 13.9 13.8 14.0 14.5 160 57 158 152 69 162 750 159 171 169 174 17.7 17.6 38.4 186 174 184 17.6 167 182 185 191 190 19.0 198 198 200 209 1995 195 184 79.3 143 133 200 201 202 231 206 207 214 215 219 M14 WEB esc Dataset Sheet2 Sheet Type here to search 12 17 343 2013 MA BE ES 143 TE 35 BE 14 VE 14 O 11 REN DI H6 w View Help Foxit PDF i - T 5 G Normal 6 B > 4- Use Exponential smoothing forecasts with alpha of 0.1, 0.2, 0.9 to predict January 2021 demand. Identify the value of alpha that results in the lowest MAD H 5- Find the monthly seasonal indices for the demand values using Simple Average (SA) method. Find the de-seasonalized demand value by dividing monthly demand by seasonal I OFE 6- Use regression to perfors trend analysat on the de-sonalized demand valoes Is trend analysis suitable for this data? Find MAD, the seconally adjusted trend forecast for January through March 2021 and explain the Excel Regreson output (trend equation, squared, goodness of model) N No Spacing N S U J 00 8 1 Heading 1 M 9 K A LOD 0 L alt O V Editing Dictate SA P scon munro 92F . Voice Sem ; 1 A Month Yr Jan. 2016 Jan 2017 Jan 2018 Jan 2019 Jan, 2020 G PERIODPRICE AIP DIFF ADV DEMAND 5.9 0.5 139 HEAR 1 2 3 4 5 6 7 8 9 10 12 13 14 15 15 17 18 19 20 21 22 23 24 26 27 28 29 30 31 33 34 35 36 37 38 39 40 41 42 43 44 45 46 47 48 49 50 51 52 53 54 55 15 43 158 630 54 5.5 6.0 6.1 59 59 59 68 6.8 64 6.5 63 61 99 6.4 60 64 6.7 65 60 -08 58 -10 63 63 62 60 6.1 64 61 61 61 64 63 04 65 60 01 68 -0.1 55 02 65 62 -0.1 63 65 04 70 61 6.6 0.5 7.7 63 0.3 0.3 03 71 08 89 SE 66 02 60 62 61 60 61 5.9 60 63 60 5.7 56 62 70 64 72 65 59 206 62 60 62 60 62 67 69 11 04 7.3 00 73 05 72 73 65 72 71 62 100 58 02 5.8 -0.5 6.0 00 67 10 64 08 08 09 6.0 70 05 72 03 75 01 78 H 80 12 82 01 83 2017 60 -10 53 6.8 02 84 06 10 91 93 50 5.8 -12 68 602 89 67 62 -05 69 60 -09 10.1 50 6.9 631 -06 102 67 65 1-02 105 70 103 71 6.1 -10 99 72 63 -0.9 10.5 64 -08 106 -0.9 105 68 94 93 94 95 96 97 9.9 66 -12 116 -09 201 59 59 -10 10.3 72 6.0 107 73 103 74 09 1018 -10 TL1 48 112 00 116 115 98 66 65 65 62 68 68 74 69 65 73 208 116 73 49 04 119 70 -02 110 72 75 75 75 315 14.5 14.7 149 14.9 14.6 14.1 120 14.2 139 13.9 13.8 14.0 14.5 160 57 158 152 69 162 750 159 171 169 174 17.7 17.6 38.4 186 174 184 17.6 167 182 185 191 190 19.0 198 198 200 209 1995 195 184 79.3 143 133 200 201 202 231 206 207 214 215 219 M14 WEB esc Dataset Sheet2 Sheet Type here to search 12 17 343 2013 MA BE ES 143 TE 35 BE 14 VE 14 O 11 REN DI H6 Step by Step Solution
There are 3 Steps involved in it
1 Expert Approved Answer
Step: 1 Unlock

Question Has Been Solved by an Expert!
Get step-by-step solutions from verified subject matter experts
Step: 2 Unlock
Step: 3 Unlock