

Question: Need help answering the questions in the side column (J) connected to the data given. G Mile walk-run (sec) VO2max (ml/kg/min) X (X-Xbar) squared (Y-Ybar)
Need help answering the questions in the side column (J) connected to the data given.
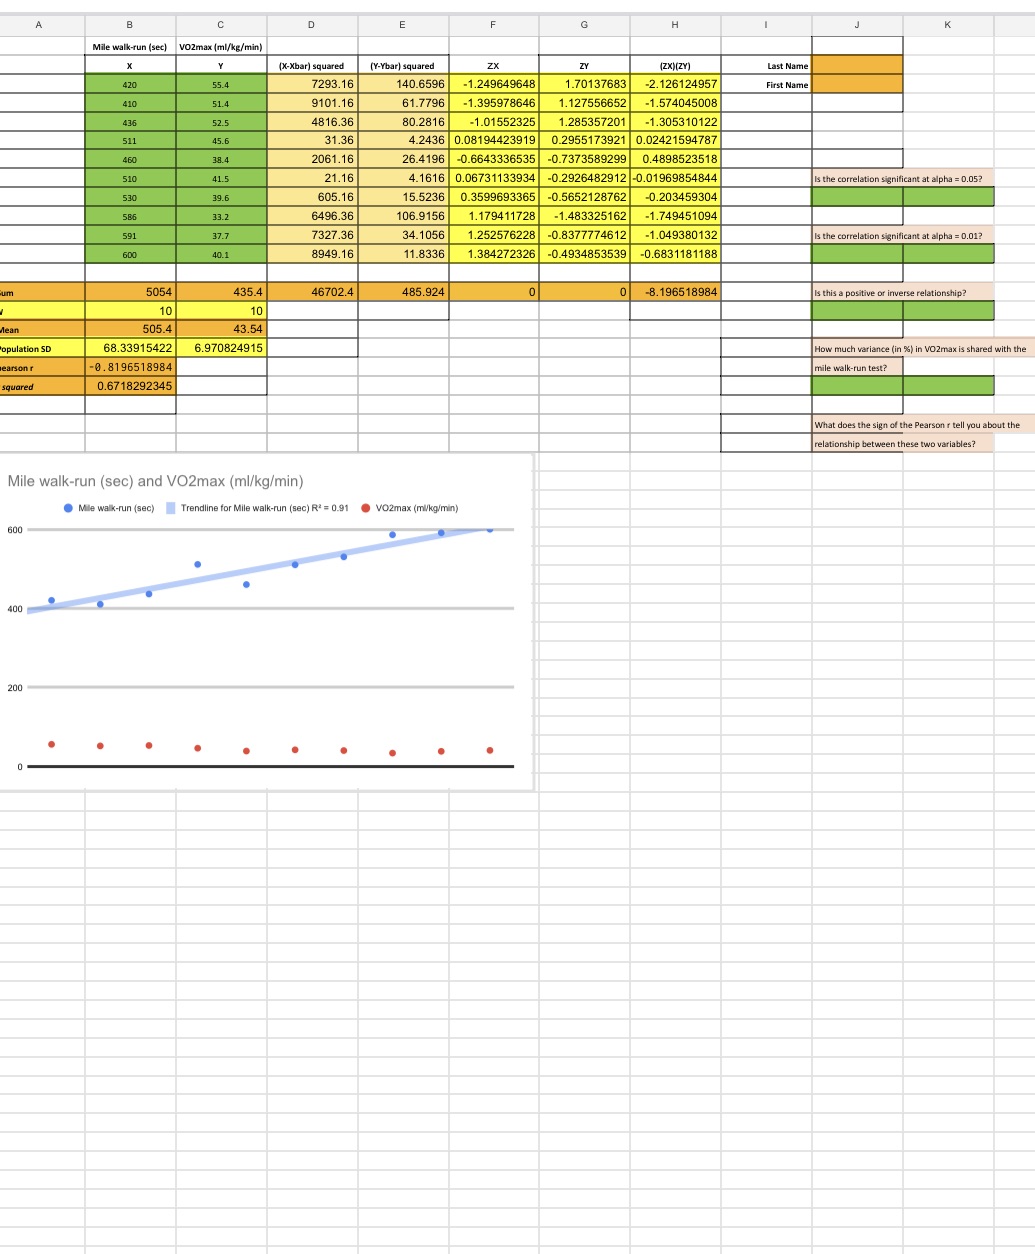
G Mile walk-run (sec) VO2max (ml/kg/min) X (X-Xbar) squared (Y-Ybar) squared ZY (ZX)[ZY) Last Name 420 55.4 293.16 140.6596 -1.249649648 1.70137683 -2.126124957 First Name 410 51.4 9101.16 61.7796 -1.395978646 1.127556652 -1.574045008 436 52.5 4816.36 80.2816 -1.01552325 1.285357201 -1.305310122 511 45 .6 31.36 4.2436 0.08194423919 0.2955173921 0.02421594787 460 38.4 2061.16 26.4196 -0.6643336535 -0.7373589299 0.4898523518 510 41.5 21.16 4.1616 0.06731133934 -0.2926482912 -0.01969854844 Is the correlation significant at alpha = 0.05? 530 39.6 605.16 15.5236 0.3599693365 -0.5652128762 -0.203459304 586 33.2 496.36 106.9156 1.179411728 -1.483325162 -1.749451094 591 37 .7 7327.3 34.1056 .252576228 -0.8377774612 -1.049380132 Is the correlation significant at alpha = 0.01? 600 40.1 8949.16 11.8336 1.384272326 -0.4934853539 -0.6831181188 5054 435.4 46702.4 485.924 0 -8.196518984 Is this a positive or inverse relationship? 10 10 505.4 43.54 opulation SD 68.33915422 6.970824915 How much variance (in %) in VO2max is shared with the earson r -0. 8196518984 mile walk-run test? squared 0.6718292345 What does the sign of the Pearson r tell you about the relationship between these two variables? Mile walk-run (sec) and VO2max (ml/kg/min) Mile walk-run (sec) Trendline for Mile walk-run (sec) R = 0.91 . VO2max (mi/kg/min) 600 400 200
Step by Step Solution
There are 3 Steps involved in it

Get step-by-step solutions from verified subject matter experts