

Question: Need help making this graph with the video game data A Similar Estimation Problem Using Data One of the learning outcomes from this course is
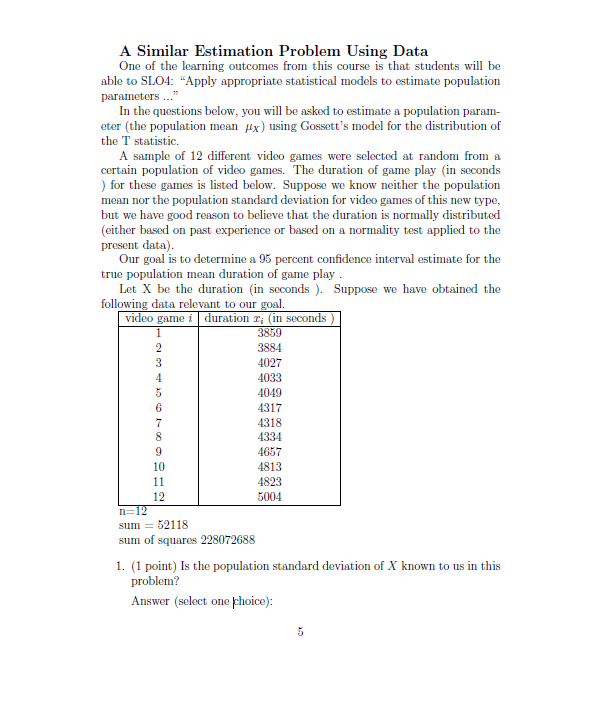
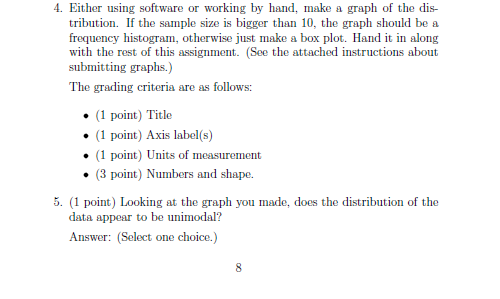 Need help making this graph with the video game data
Step by Step Solution
There are 3 Steps involved in it
1 Expert Approved Answer
Step: 1 Unlock

Question Has Been Solved by an Expert!
Get step-by-step solutions from verified subject matter experts
Step: 2 Unlock
Step: 3 Unlock