

Question: Need Help understanding part C and D. This is how my teacher partially did B and C. I understand A and B but C I'm
Need Help understanding part C and D. This is how my teacher partially did B and C. I understand A and B but C I'm having a hard time following what the teacher did and then D I don't even know. If someone could steer me in the right direction. Like why did Ms multiply the experimental prob by 10?
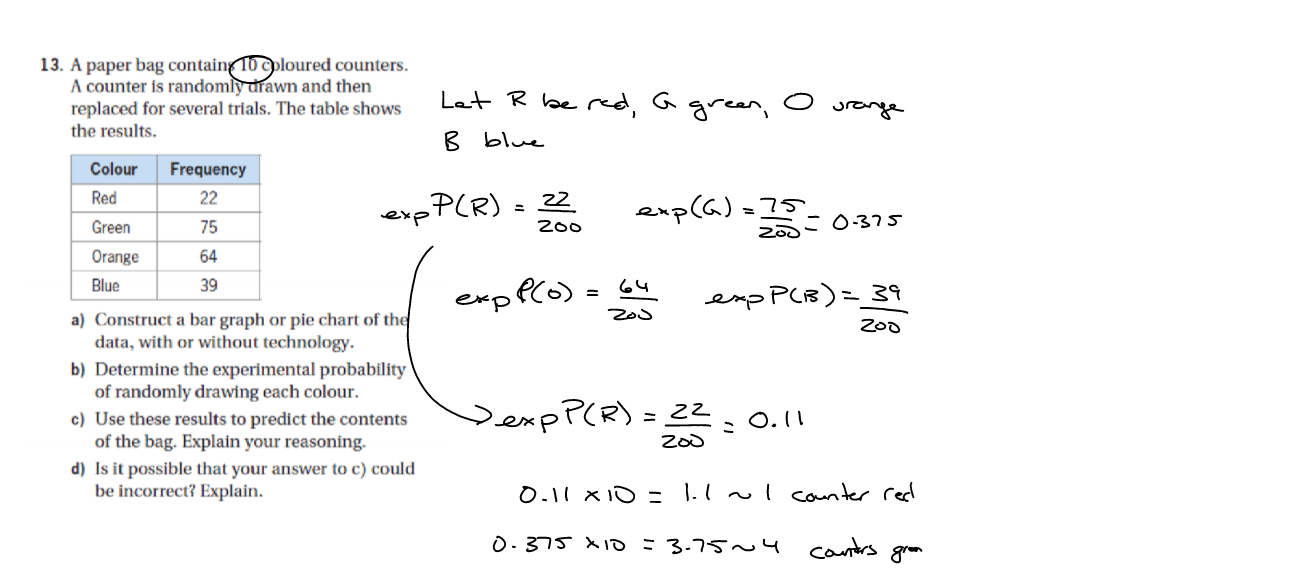
13. A paper bag contain 10 coloured counters. A counter is randomly drawn and then replaced for several trials. The table shows Let R be red , G green , O vrange the results. B blue Colour Frequency Red 22 Green 75 expP(R ) = 22 200 exp ( G ) = 12 - 0-375 200 Orange 64 Blue 39 expp (0) = 64 205 expp( B ) = 39 a) Construct a bar graph or pie chart of the data, with or without technology. b) Determine the experimental probability of randomly drawing each colour. c) Use these results to predict the contents DexpP (R ) = 22 . 0.11 of the bag. Explain your reasoning. zoo d) Is it possible that your answer to c) could be incorrect? Explain. 0. 1 1 X 10 = 1.1 ~ I counter red 0. 375 X 10 : 3.75 4 counters grow
Step by Step Solution
There are 3 Steps involved in it

Get step-by-step solutions from verified subject matter experts