

Question: Need help with math problems below The table shows the percent drop in price of several MP3 players relative to their time since entering the
Need help with math problems below
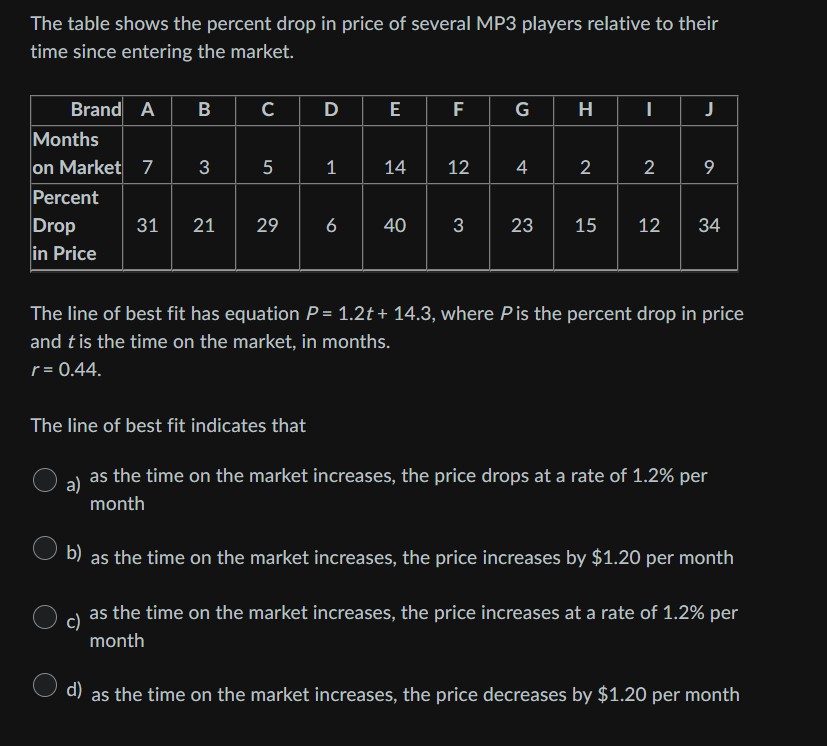
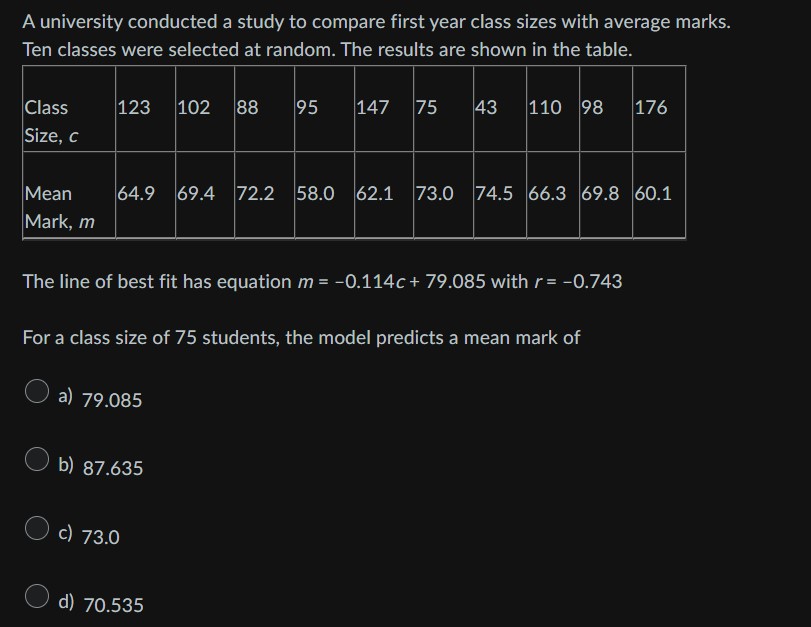
The table shows the percent drop in price of several MP3 players relative to their time since entering the market. Brand A B C D E F G H Months on Market 7 3 5 1 14 12 4 2 2 9 Percent Drop 31 21 29 6 40 3 23 15 12 34 in Price The line of best fit has equation P= 1.2t+ 14.3, where Pis the percent drop in price and t is the time on the market, in months. r = 0.44. The line of best fit indicates that O a) as the time on the market increases, the price drops at a rate of 1.2% per month b) as the time on the market increases, the price increases by $1.20 per month O c) as the time on the market increases, the price increases at a rate of 1.2% per month d) as the time on the market increases, the price decreases by $1.20 per monthA university conducted a study to compare first year class sizes with average marks. Ten classes were selected at random. The results are shown in the table. Class 123 102 88 95 147 75 143 110 198 176 Size, C Mean 64.9 69.4 72.2 58.0 62.1 73.0 74.5 66.3 69.8 60.1 Mark, m The line of best fit has equation m = -0.114c + 79.085 with r= -0.743 For a class size of 75 students, the model predicts a mean mark of a) 79.085 b) 87.635 O c) 73.0 O d) 70.535
Step by Step Solution
There are 3 Steps involved in it

Get step-by-step solutions from verified subject matter experts