

Question: Need help with the question from the picture The number of contaminating particles on a silicon wafer prior to a certain rinsing process was determined
Need help with the question from the picture
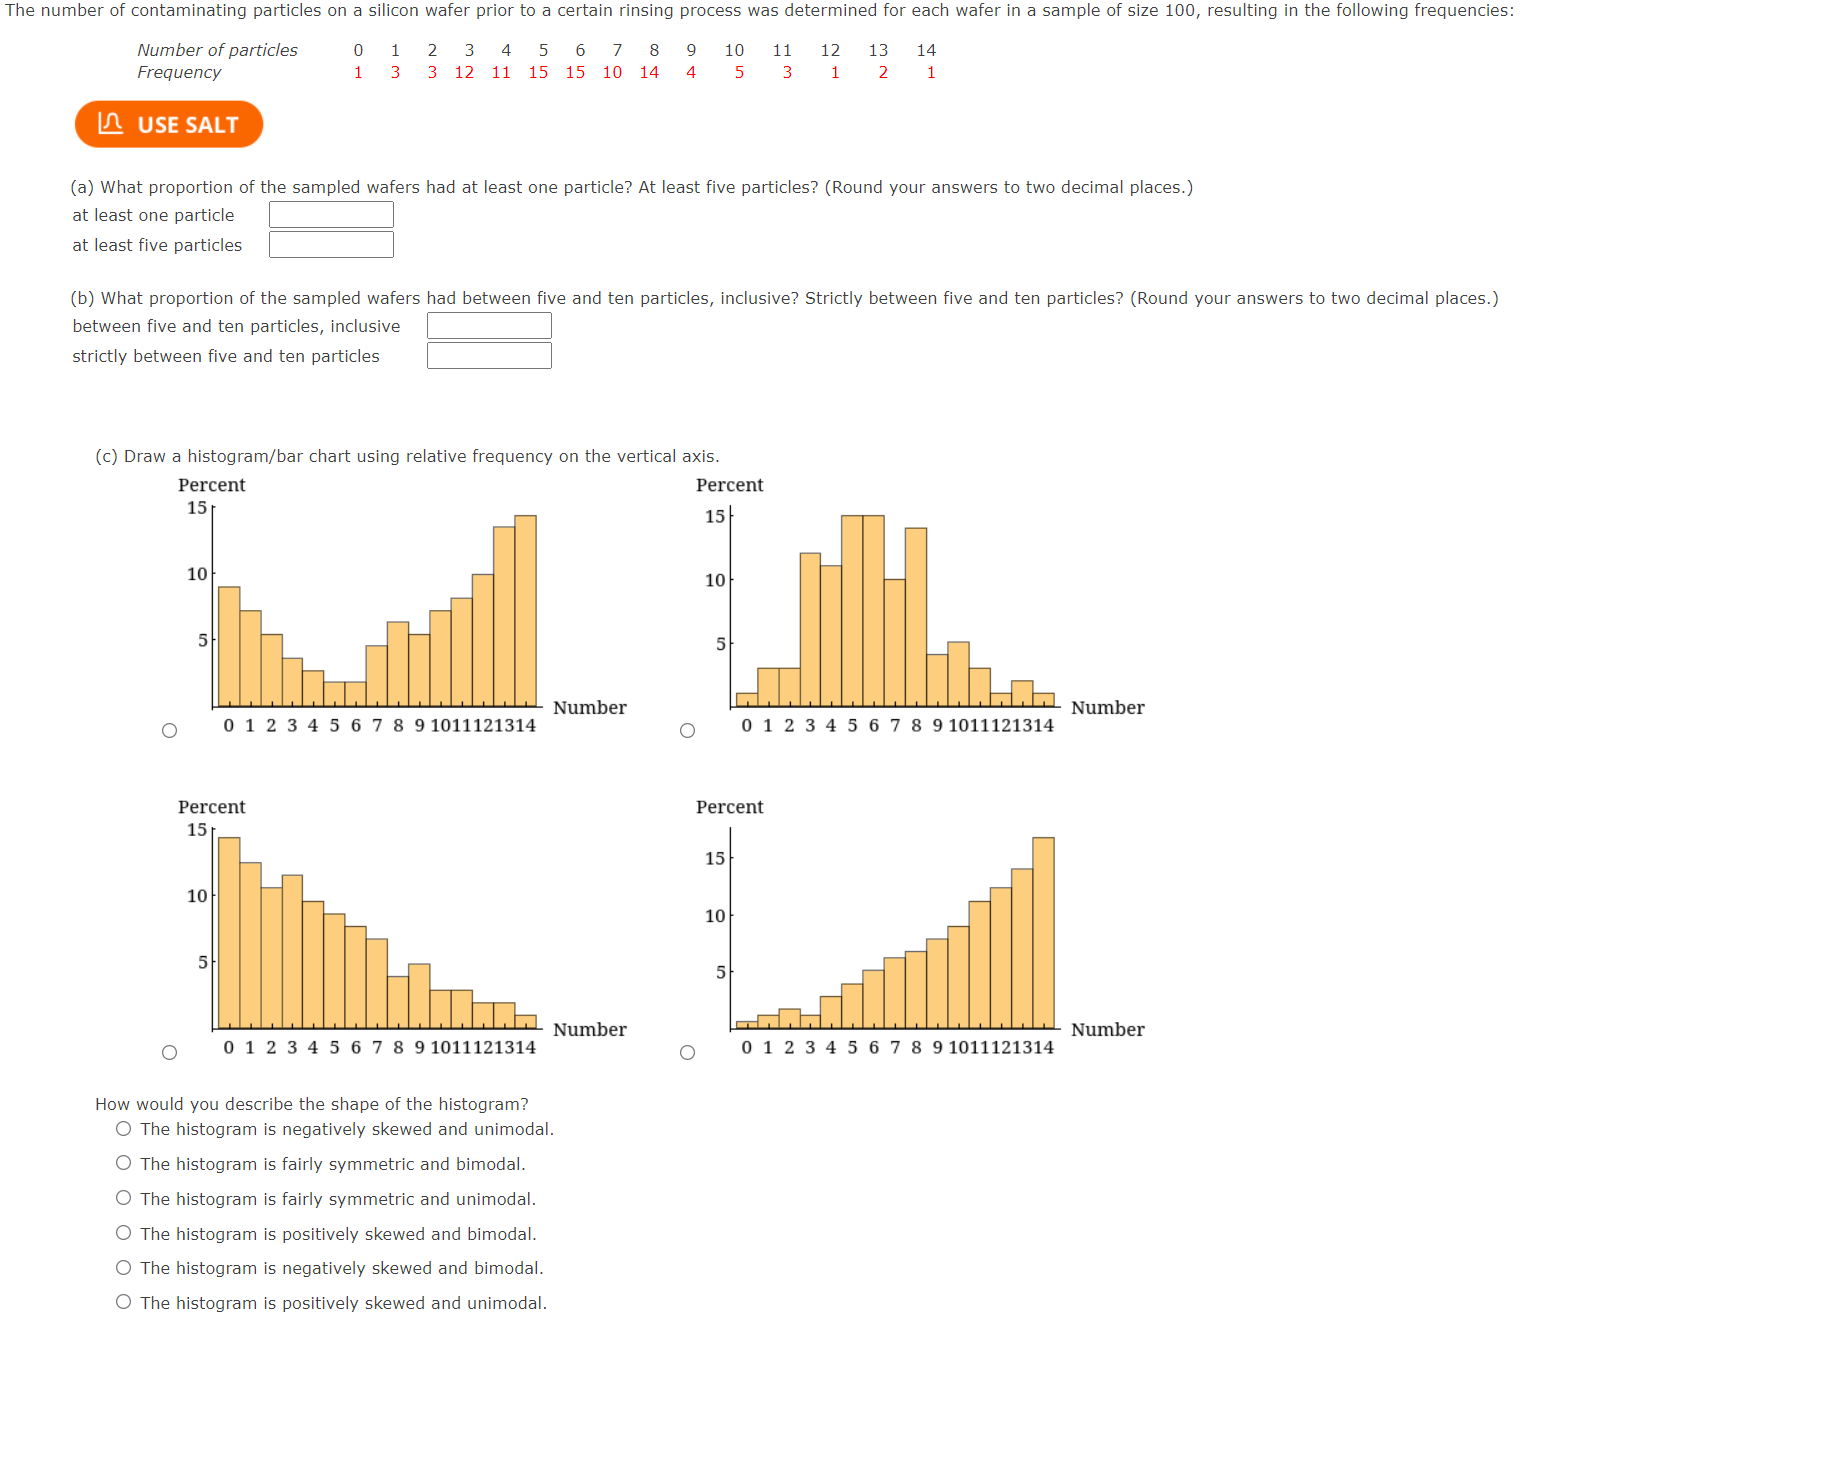
The number of contaminating particles on a silicon wafer prior to a certain rinsing process was determined for each wafer in a sample of size 100, resulting in the following frequencies: Number of particles 2 3 4 6 7 8 9 10 11 12 13 14 Frequency 1 3 12 11 15 15 10 14 4 5 3 1 1 LO USE SALT (a) What proportion of the sampled wafers had at least one particle? At least five particles? (Round your answers to two decimal places.) at least one particle at least five particles (b) What proportion of the sampled wafers had between five and ten particles, inclusive? Strictly between five and ten particles? (Round your answers to two decimal places.) between five and ten particles, inclusive strictly between five and ten particles (c) Draw a histogram/bar chart using relative frequency on the vertical axis. Percent Percent 15 15 10 10 5 Number Number O 0 1 2 3 4 5 6 7 8 9 1011121314 O 0 1 2 3 4 5 6 7 8 9 1011121314 Percent Percent 15 15 10 10 5 5 Number Number O 0 1 2 3 4 5 6 7 8 9 1011 121314 O 0 1 2 3 4 5 6 7 8 9 1011121314 How would you describe the shape of the histogram? O The histogram is negatively skewed and unimodal. O The histogram is fairly symmetric and bimodal. O The histogram is fairly symmetric and unimodal. O The histogram is positively skewed and bimodal O The histogram is negatively skewed and bimodal. The histogram is positively skewed and unimodal
Step by Step Solution
There are 3 Steps involved in it

Get step-by-step solutions from verified subject matter experts