

Question: Need help with The scatter plot shows the relationship between the time spent to complete the first project and the number of projects attempted in
Need help with
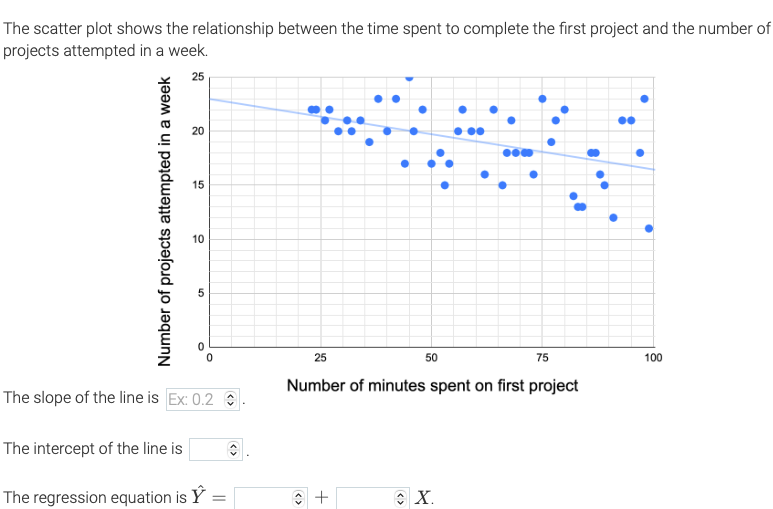
The scatter plot shows the relationship between the time spent to complete the first project and the number of projects attempted in a week. 25 20 15 Number of projects attempted in a week 10 5 0 25 50 75 100 Number of minutes spent on first project The slope of the line is Ex: 0.2 The intercept of the line is The regression equation is Y =
Step by Step Solution
There are 3 Steps involved in it
1 Expert Approved Answer
Step: 1 Unlock

Question Has Been Solved by an Expert!
Get step-by-step solutions from verified subject matter experts
Step: 2 Unlock
Step: 3 Unlock