

Question: The scatter plot shows the relationship between the time spent to complete the first project and the number of projects attempted in a week. 25
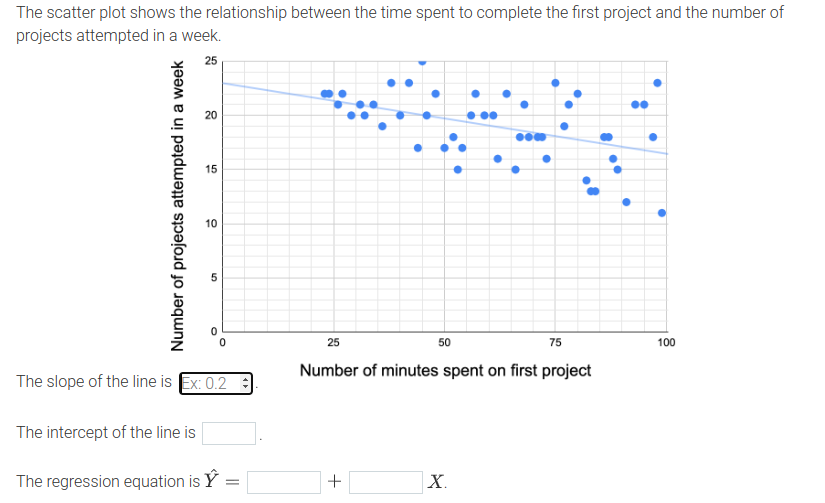
The scatter plot shows the relationship between the time spent to complete the first project and the number of projects attempted in a week. 25 20 15 Number of projects attempted in a week 10 5 0 0 25 50 75 100 The slope of the line is |Ex: 0.2 Number of minutes spent on first project The intercept of the line is The regression equation is Y = + X
Step by Step Solution
There are 3 Steps involved in it
1 Expert Approved Answer
Step: 1 Unlock

Question Has Been Solved by an Expert!
Get step-by-step solutions from verified subject matter experts
Step: 2 Unlock
Step: 3 Unlock