

Question: need my plot to look like the top one Q2: plot correlation lines of Glucose and Age while differentiating between individuals with diabetes and those
need my plot to look like the top one 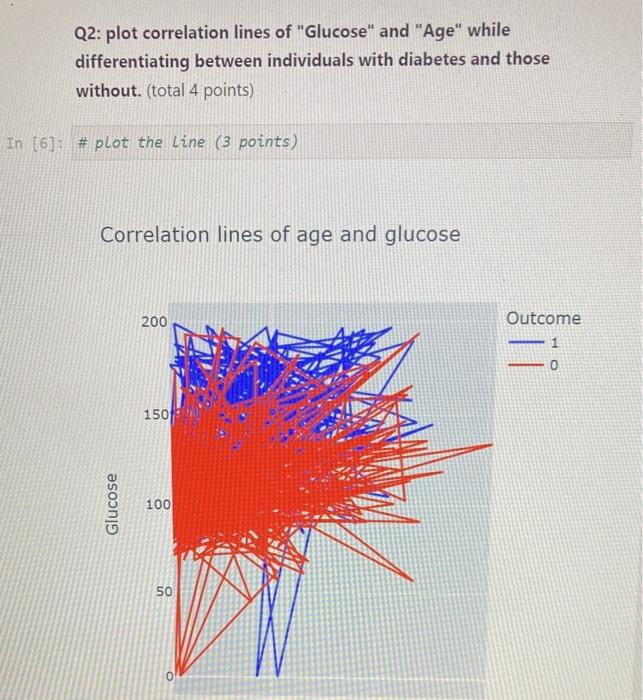
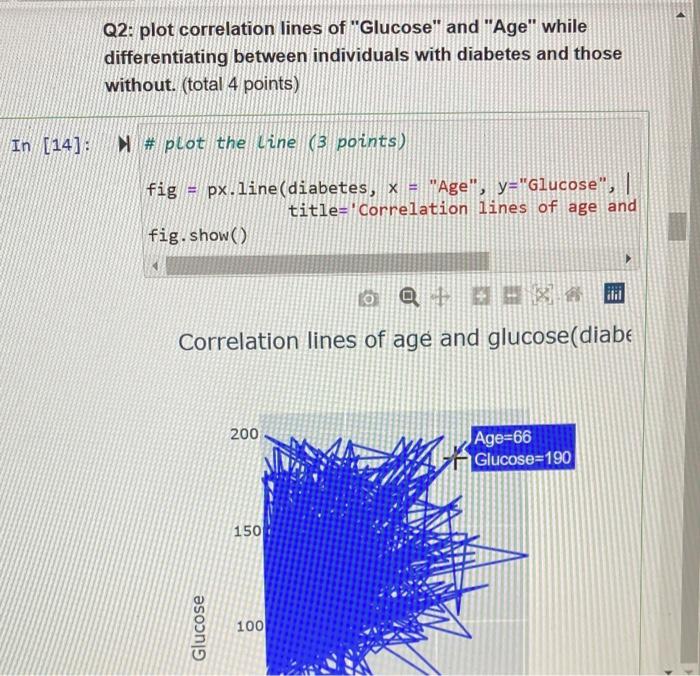
Q2: plot correlation lines of "Glucose" and "Age" while differentiating between individuals with diabetes and those without. (total 4 points) Correlation lines of age and glucose Q2: plot correlation lines of "Glucose" and "Age" while differentiating between individuals with diabetes and those without. (total 4 points) M \# plot the line (3 points) fig =px. line (diabetes, x= "Age", y= "Glucose", I title = 'Correlation lines of age and fig.show () Correlation lines of age and glucose(diabe
Step by Step Solution
There are 3 Steps involved in it
1 Expert Approved Answer
Step: 1 Unlock

Question Has Been Solved by an Expert!
Get step-by-step solutions from verified subject matter experts
Step: 2 Unlock
Step: 3 Unlock