

Question: need the following code for each output. Q2: plot correlation lines of Glucose and Age while differentiating between individuals with diabetes and those without. (total
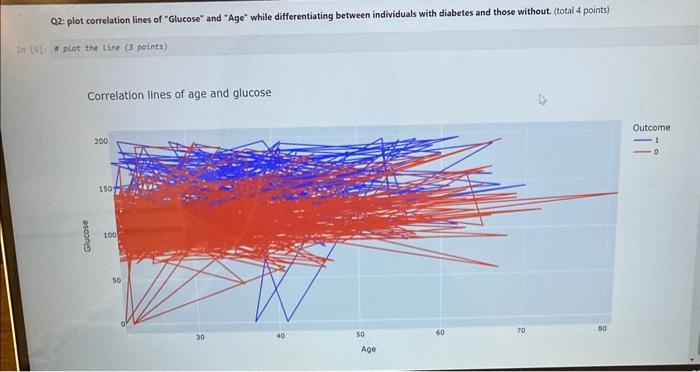
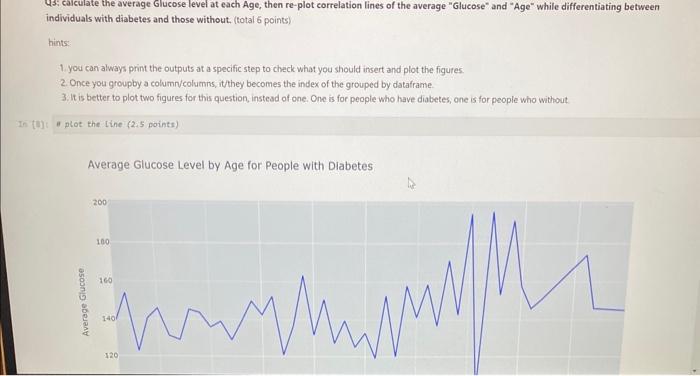
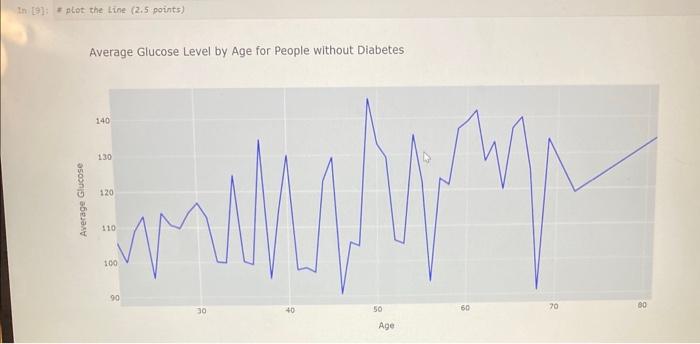
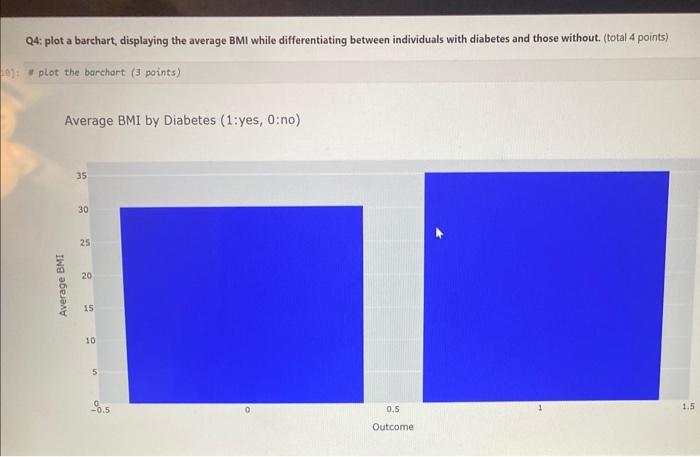
Q2: plot correlation lines of "Glucose" and "Age" while differentiating between individuals with diabetes and those without. (total 4 points) A plot the tine (3 points) Correlation lines of age and glucose Q3: caiculate the average Glucose level at each Age, then re-plot correlation lines of the average "Glucose" and "Age" while differentiating between individuals with diabetes and those without. (total 6 points) hints: 1. you can always print the outputs at a specific step to check what you should insert and plot the figures. 2. Once you groupby a column/columns, itthey becomes the index of the grouped by dataframe. 3. It is better to plot two figures for this question, instead of one. One is for people who have diatetes, one is for people who without. a plot the tine (2,5 points) Average Glucose Level by Age for People with Diabetes Average Glucose Level by Age for People without Diabetes Q4: plot a barchart, displaying the average BMI while differentiating between individuals with diabetes and those without. (total 4 points) - plot the barchart (3 points) Average BMI by Diabetes (1:yes, 0:no)
Step by Step Solution
There are 3 Steps involved in it

Get step-by-step solutions from verified subject matter experts