

Question: need part c An automatic lathe produces rollers for roller bearings, and the process is monitored by statistical process control charts. The central line of
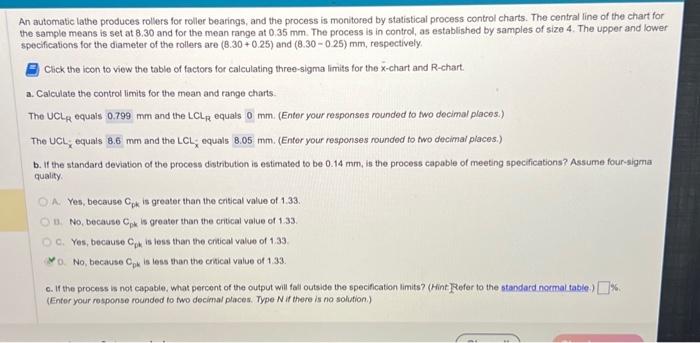
An automatic lathe produces rollers for roller bearings, and the process is monitored by statistical process control charts. The central line of the chart fo he sample means is set at 8.30 and for the mean range at 0.35mm. The process is in control, as established by samples of size 4 . The upper and lowi specifications for the diameter of the rollers are (8.30+0.25) and (8.300.25)mm, respectively. Click the icon to view the table of factors for calculating three-sigma limits for the x-chart and R-chart. a. Calculate the controf limits for the mean and range charts. The UCL URR equais mm and the LCLR equals mm. (Enter your responses rounded to two decimal places.) The UCL, equals mm and the LCL- equals Mm. (Enter your responses rounded to two decimal places.) b. If the standard deviation of the process distribution is estimated to be 0.14mm, is the process capable of meeting specifications? Assume four-sigma quality. A. Yes, because Cpk is greater than the critical value of 1.33 . 13. No, because Cpk is greater than the critical value of 1.33 . C. Yes, because Cpk is less than the crtical value of 1,33 0. No, because Cpk is less than the critical value of 1.33 . c. If the process is not capable, what percent of the output will fall outside the specification limits? (Hint I Refer to the standard normal tabie.) (Enter your response rounded to wo decimal places. Type N if there is no solution.)
Step by Step Solution
There are 3 Steps involved in it

Get step-by-step solutions from verified subject matter experts