

Question: Need to use the Sample to Decide. 1. Based on the normal probability plot (NPP) of our sample shown below, does it appear that a
Need to use the Sample to Decide.
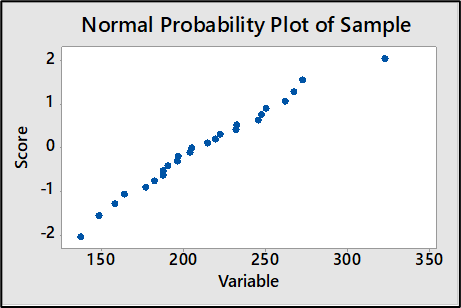
1. Based on the normal probability plot (NPP) of our sample shown below, does it appear that a normal probability model is appropriate for the population from which the sample came?
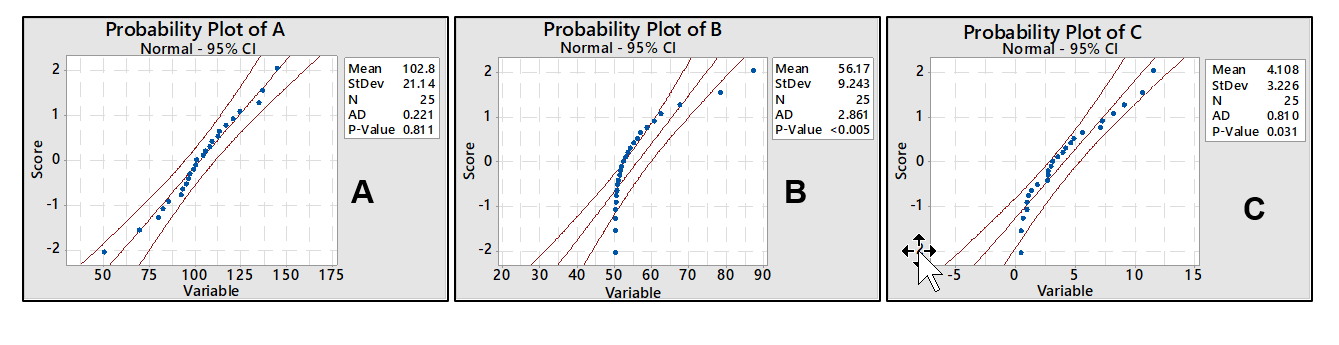

Probability Plot of A Probability Plot of B Probability Plot of C Normal - 95% CI Normal - 95% CI Normal - 95% CI Mean 102.8 Mean 56.17 2 Mean 4.108 2 N 3.226 StDev 21.14 StDev 9.243 StDev N 25 N 25 N 25 AD 0.221 AD 2.861 AD 0.81 0 1 P-Value 0.811 P-Value
Step by Step Solution
There are 3 Steps involved in it
1 Expert Approved Answer
Step: 1 Unlock

Question Has Been Solved by an Expert!
Get step-by-step solutions from verified subject matter experts
Step: 2 Unlock
Step: 3 Unlock