

New Heritage Doll Company: Capital Budgeting NPV Sensitivity Analyses NPV of Match My Doll Clothing Line...
Fantastic news! We've Found the answer you've been seeking!
Question:

Transcribed Image Text:
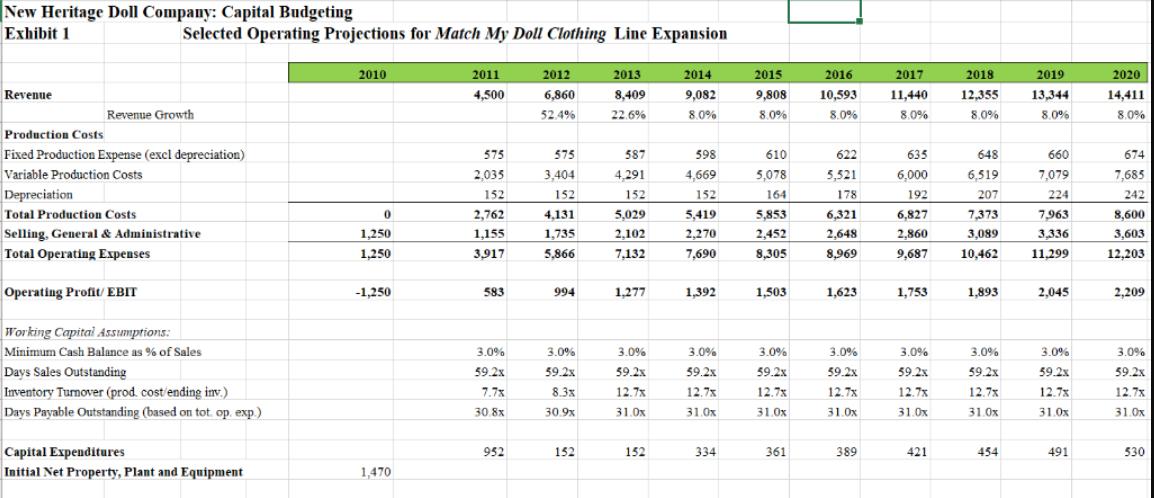
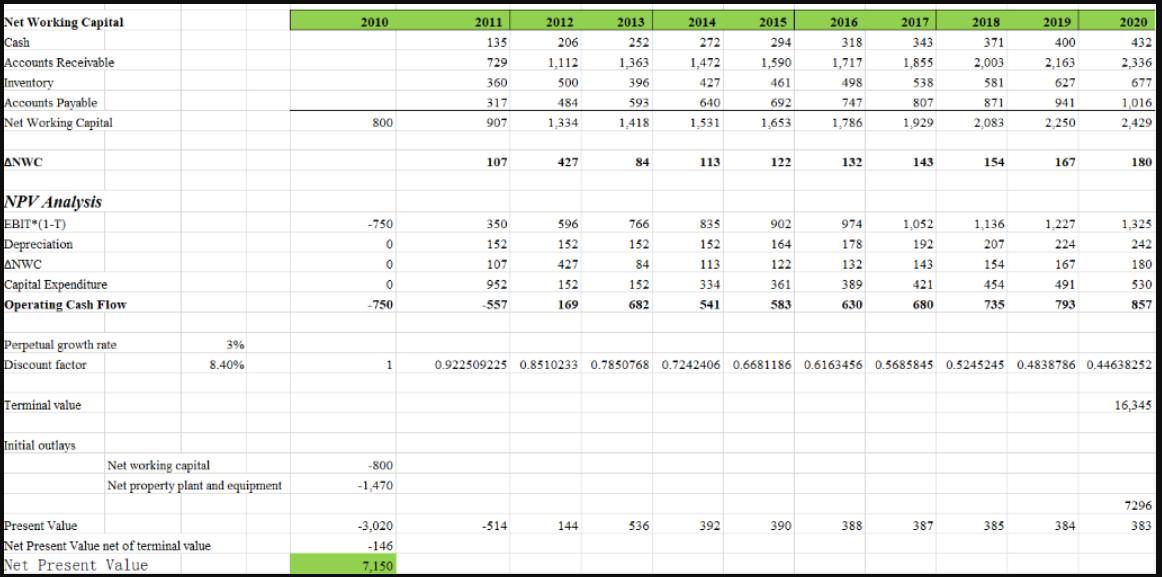
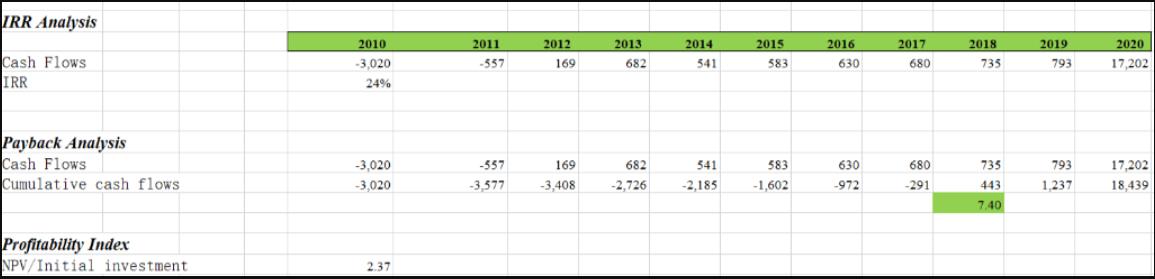
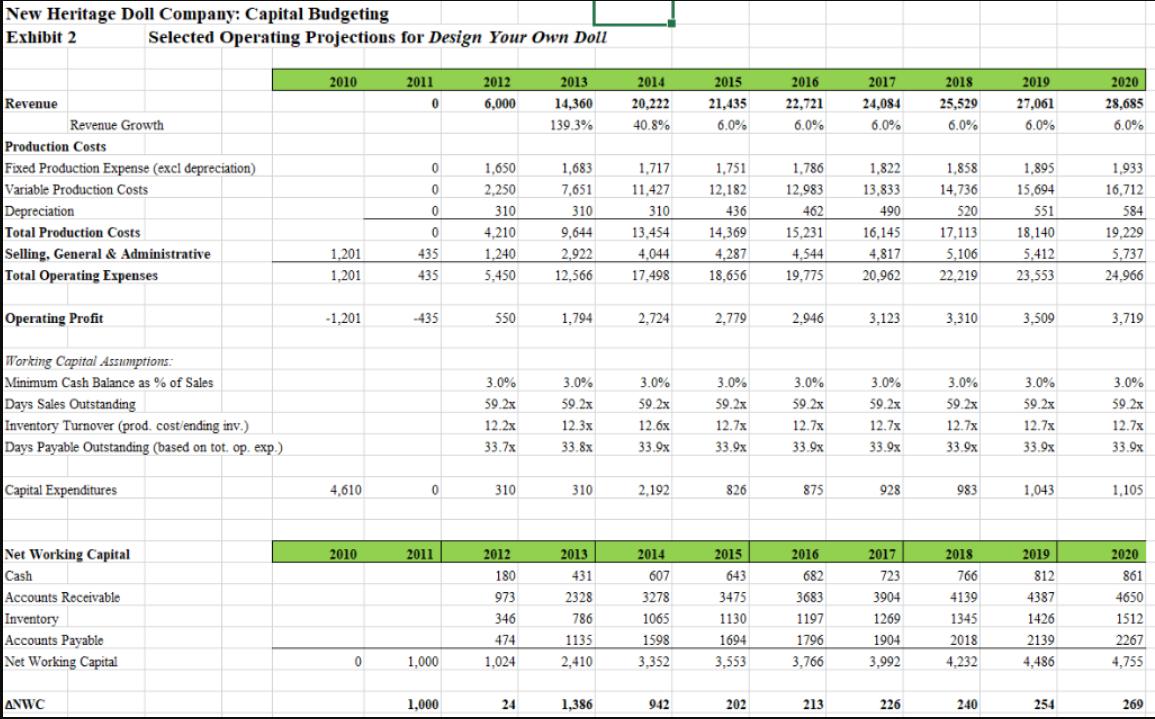
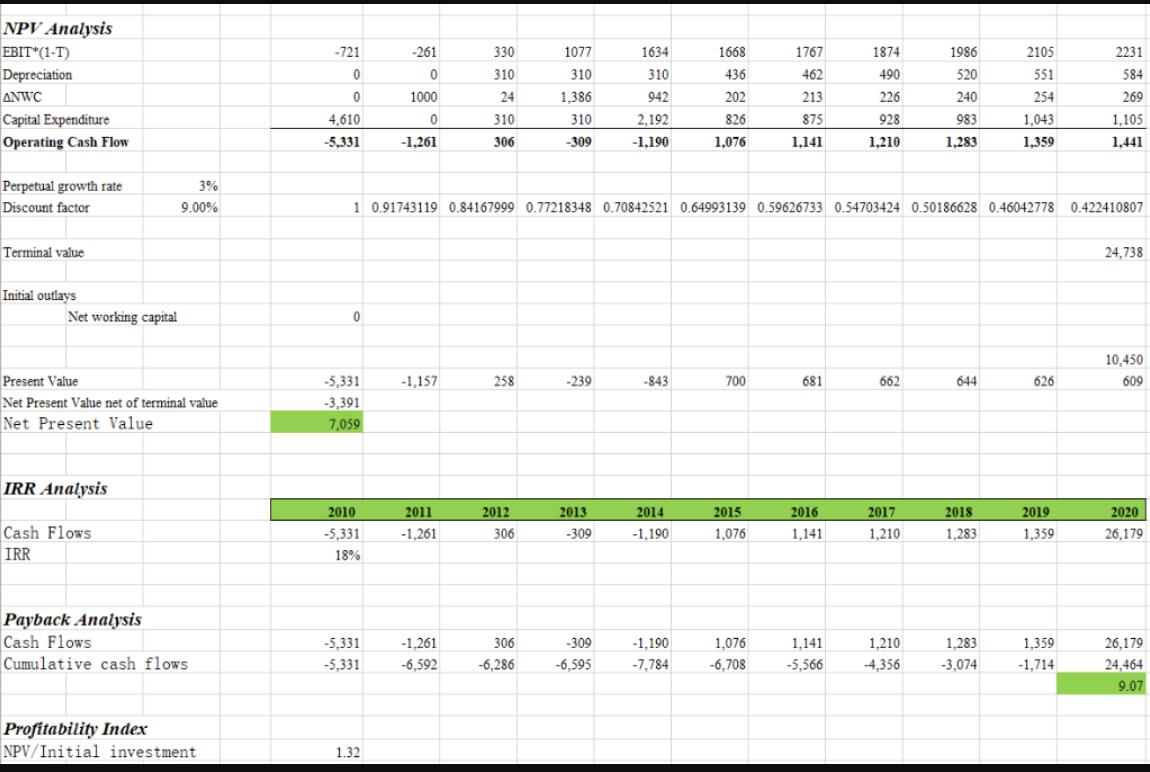
New Heritage Doll Company: Capital Budgeting NPV Sensitivity Analyses NPV of Match My Doll Clothing Line Extension NPV if TV growth rate TV=BV of Discount rate 0% 1% 2% 3% NWC + PPE 7.70% 8.40% 9.00% NPV of Design Your Own Doll NPV if TV growth rate TV=BV of Discount rate 0% 1% 2% 3% NWC + PPE 7.70% 8.40% 9.00% New Heritage Doll Company: Capital Budgeting Exhibit 1 Selected Operating Projections for Match My Doll Clothing Line Expansion 2010 2011 2012 2013 2014 2015 2016 2017 2018 2019 2020 Revenue 4,500 6,860 8,409 9,082 9,808 10,593 11,440 12,355 13,344 14,411 Revenue Growth 52.4% 22.6% 8.0% 8.0% 8.0% 8.0% 8.0% 8.0% 8.0% Production Costs Fixed Production Expense (excl depreciation) Variable Production Costs Depreciation 575 575 587 598 610 622 635 648 660 674 2,035 3,404 4,291 4,669 5,078 5,521 6,000 6,519 7,079 7,685 152 152 152 152 164 178 192 207 224 242 Total Production Costs 2,762 4,131 5,029 5,419 5,853 6,321 6,827 7,373 7,963 8,600 Selling, General & Administrative 1,250 1,155 1,735 3,336 2,102 7,132 2,270 2,452 2,648 2,860 3,089 3,603 Total Operating Expenses 1,250 3,917 5,866 7,690 8,305 8,969 9,687 10,462 11.299 12,203 Operating Profit/ EBIT -1,250 583 994 1,277 1,392 1,503 1,623 1,753 1,893 2,045 2,209 Working Capitai Assumptions: Minimum Cash Balance as % of Sales Days Sales Outstanding Inventory Tumover (prod. cost ending inv.) Days Payable Outstanding (based on tot op. exp) 3.0% 3.0% 3.0% 3.0% 3.0% 3.0% 3.0% 3.0% 3.0% 3.0% 59.2x 59.2x 59.2x 59.2x 59.2x 59.2x 59.2x 59.2x 59.2x 59.2x 7.7x 8.3x 12.7x 12,7x 12.7x 12.7x 12.7x 12.7x 12.7x 12.7x 30.8x 30.9x 31.0x 31.0x 31.0x 31.0x 31.0x 31.0x 31.0x 31.0x Capital Expenditures Initial Net Property, Plant and Equipment 952 152 152 334 361 389 421 454 491 530 1,470 Net Working Capital Cash Accounts Receivable Inventory Accounts Payable Net Working Capital 2010 2011 2012 2013 2014 2015 2016 2017 2018 2019 2020 135 206 252 272 294 318 343 371 400 432 729 1,112 1,363 1,472 1,590 1,717 1,855 2,003 2,163 2,336 360 500 396 427 461 498 538 581 627 677 317 484 593 640 692 747 807 871 941 1,016 800 907 1,334 1,418 1,531 1,653 1,786 1,929 2,083 2,250 2,429 ANWC 107 427 84 113 122 132 143 154 167 180 NPV Analysis EBIT (1-T) Depreciation ANWC Capital Expenditure Operating Cash Flow -750 350 596 766 835 902 974 1,052 1,136 1,227 1,325 152 152 152 152 164 178 192 207 224 242 107 427 84 113 122 132 143 154 167 180 952 152 152 334 361 389 421 454 491 530 -750 557 169 682 541 583 630 680 735 793 857 Perpetual growth rate Discount factor 3% 8.40% 1 0.922509225 0.8510233 0.7850768 0.7242406 0.6681186 0.6163456 0.5685845 0.5245245 0.4838786 0.44638252 Terminal value 16,345 Initial outlays Net working capital Net property plant and equipment -800 -1,470 7296 Present Value Net Present Value net of terminal value Net Present Value -3,020 -514 144 536 392 390 388 387 385 384 383 -146 7,150 IRR Analysis 2010 2011 2012 2013 2014 2015 2016 2017 2018 2019 2020 Cash Flows -3,020 -557 169 682 541 583 630 680 735 793 17,202 IRR 24% Payback Analysis Cash Flows Cumulative cash flows -3,020 -557 169 682 541 583 630 680 735 793 17,202 -3,020 -3,577 -3,408 -2,726 -2,185 -1,602 -972 -291 443 1,237 18,439 7.40 Profitability Index NPV/Initial investment 2.37 New Heritage Doll Company: Capital Budgeting Exhibit 2 Selected Operating Projections for Design Your Own Doll 2010 2011 2012 2013 2014 2015 2016 2017 2018 2019 2020 Revenue 6,000 14,360 20,222 21,435 22,721 24,084 25,529 27,061 28,685 Revenue Growth 139.3% 40.8% 6.0% 6.0% 6.0% 6.0% 6.0% 6.0% Production Costs Fixed Production Expense (excl depreciation) Variable Production Costs 1,650 1,683 1,717 1,751 1,786 1,822 1,858 1,895 1,933 2,250 7,651 11,427 12,182 12,983 13,833 14,736 15,694 16,712 Depreciation Total Production Costs 310 310 310 436 462 490 520 551 584 4,210 9,644 13,454 14,369 15,231 16,145 17,113 18,140 19,229 Selling, General & Administrative Total Operating Expenses 1.201 435 1,240 2,922 4,044 4.287 4,544 4,817 5,106 5,412 5,737 1,201 435 5,450 12,566 17,498 18,656 19,775 20,962 22.219 23,553 24,966 Operating Profit -1,201 -435 550 1,794 2,724 2,779 2,946 3,123 3.310 3,509 3,719 Working Capital ASsumptions: Minimum Cash Balance as % of Sales 3.0% 3.0% 3.0% 3.0% 3.0% 3.0% 3.0% 3.0% 3.0% Days Sales Outstanding Inventory Turnover (prod. cost'ending inv.) Days Payable Outstanding (based on tot, op. exp.) 59.2x 59.2x 59.2x 59.2x 59.2x 59.2x 59.2x 59.2x 59.2x 12.2x 12.3x 12.6x 12.7x 12.7x 12.7x 12.7x 12.7x 12.7x 33.7x 33.8x 33.9x 33.9x 33.9x 33.9x 33.9x 33.9x 33.9x Capital Expenditures 4,610 310 310 2,192 826 875 928 983 1,043 1,105 Net Working Capital 2010 2011 2012 2013 2014 2015 2016 2017 2018 2019 2020 Cash 180 431 607 643 682 723 766 812 861 Accounts Receivable 973 2328 3278 3475 3683 3904 4139 4387 4650 Inventory Accounts Payable Net Working Capital 346 786 1065 1130 1197 1269 1345 1426 1512 474 1135 1598 1694 1796 1904 2018 2139 2267 1,000 1,024 2,410 3,352 3,553 3,766 3,992 4.232 4,486 4,755 ANWC 1,000 24 1,386 942 202 213 226 240 254 269 NPV Analysis FBIT*(1-T) Depreciation ANWC Capital Expenditure Operating Cash Flow -721 -261 330 1077 1634 1668 1767 1874 1986 2105 2231 310 310 310 436 462 490 520 551 584 1000 24 1,386 942 202 213 226 240 254 269 4,610 310 310 2,192 826 875 928 983 1,043 1,105 -5,331 -1.261 306 -309 -1.190 1,076 1.141 1.210 1.283 1.359 1,441 Perpetual growth rate Discount factor 3% 9.00% 1 0.91743119 0.84167999 0.77218348 0.70842521 0.64993139 0.59626733 0.54703424 0.50186628 0.46042778 0.422410807 Terminal value 24,738 Initial outlays Net working capital 10,450 Present Value Net Present Value net of terminal value Net Present Value -5,331 -1,157 258 -239 -843 700 681 662 644 626 609 -3,391 7,059 IRR Analysis 2010 2011 2012 2013 2014 2015 2016 2017 2018 2019 2020 Cash Flows IRR -5,331 -1,261 306 -309 -1,190 1.076 1,141 1,210 1,283 1,359 26,179 18% Payback Analysis Cash Flows Cumulative cash flows -5,331 -1,261 306 -309 -1,190 1,076 1,141 1,210 1,283 1,359 26,179 -5,331 -6,592 -6,286 -6,595 -7,784 -6,708 -5,566 -4,356 -3,074 -1,714 24,464 9.07 Profitability Index NPV/Initial investment 1.32 New Heritage Doll Company: Capital Budgeting NPV Sensitivity Analyses NPV of Match My Doll Clothing Line Extension NPV if TV growth rate TV=BV of Discount rate 0% 1% 2% 3% NWC + PPE 7.70% 8.40% 9.00% NPV of Design Your Own Doll NPV if TV growth rate TV=BV of Discount rate 0% 1% 2% 3% NWC + PPE 7.70% 8.40% 9.00% New Heritage Doll Company: Capital Budgeting Exhibit 1 Selected Operating Projections for Match My Doll Clothing Line Expansion 2010 2011 2012 2013 2014 2015 2016 2017 2018 2019 2020 Revenue 4,500 6,860 8,409 9,082 9,808 10,593 11,440 12,355 13,344 14,411 Revenue Growth 52.4% 22.6% 8.0% 8.0% 8.0% 8.0% 8.0% 8.0% 8.0% Production Costs Fixed Production Expense (excl depreciation) Variable Production Costs Depreciation 575 575 587 598 610 622 635 648 660 674 2,035 3,404 4,291 4,669 5,078 5,521 6,000 6,519 7,079 7,685 152 152 152 152 164 178 192 207 224 242 Total Production Costs 2,762 4,131 5,029 5,419 5,853 6,321 6,827 7,373 7,963 8,600 Selling, General & Administrative 1,250 1,155 1,735 3,336 2,102 7,132 2,270 2,452 2,648 2,860 3,089 3,603 Total Operating Expenses 1,250 3,917 5,866 7,690 8,305 8,969 9,687 10,462 11.299 12,203 Operating Profit/ EBIT -1,250 583 994 1,277 1,392 1,503 1,623 1,753 1,893 2,045 2,209 Working Capitai Assumptions: Minimum Cash Balance as % of Sales Days Sales Outstanding Inventory Tumover (prod. cost ending inv.) Days Payable Outstanding (based on tot op. exp) 3.0% 3.0% 3.0% 3.0% 3.0% 3.0% 3.0% 3.0% 3.0% 3.0% 59.2x 59.2x 59.2x 59.2x 59.2x 59.2x 59.2x 59.2x 59.2x 59.2x 7.7x 8.3x 12.7x 12,7x 12.7x 12.7x 12.7x 12.7x 12.7x 12.7x 30.8x 30.9x 31.0x 31.0x 31.0x 31.0x 31.0x 31.0x 31.0x 31.0x Capital Expenditures Initial Net Property, Plant and Equipment 952 152 152 334 361 389 421 454 491 530 1,470 Net Working Capital Cash Accounts Receivable Inventory Accounts Payable Net Working Capital 2010 2011 2012 2013 2014 2015 2016 2017 2018 2019 2020 135 206 252 272 294 318 343 371 400 432 729 1,112 1,363 1,472 1,590 1,717 1,855 2,003 2,163 2,336 360 500 396 427 461 498 538 581 627 677 317 484 593 640 692 747 807 871 941 1,016 800 907 1,334 1,418 1,531 1,653 1,786 1,929 2,083 2,250 2,429 ANWC 107 427 84 113 122 132 143 154 167 180 NPV Analysis EBIT (1-T) Depreciation ANWC Capital Expenditure Operating Cash Flow -750 350 596 766 835 902 974 1,052 1,136 1,227 1,325 152 152 152 152 164 178 192 207 224 242 107 427 84 113 122 132 143 154 167 180 952 152 152 334 361 389 421 454 491 530 -750 557 169 682 541 583 630 680 735 793 857 Perpetual growth rate Discount factor 3% 8.40% 1 0.922509225 0.8510233 0.7850768 0.7242406 0.6681186 0.6163456 0.5685845 0.5245245 0.4838786 0.44638252 Terminal value 16,345 Initial outlays Net working capital Net property plant and equipment -800 -1,470 7296 Present Value Net Present Value net of terminal value Net Present Value -3,020 -514 144 536 392 390 388 387 385 384 383 -146 7,150 IRR Analysis 2010 2011 2012 2013 2014 2015 2016 2017 2018 2019 2020 Cash Flows -3,020 -557 169 682 541 583 630 680 735 793 17,202 IRR 24% Payback Analysis Cash Flows Cumulative cash flows -3,020 -557 169 682 541 583 630 680 735 793 17,202 -3,020 -3,577 -3,408 -2,726 -2,185 -1,602 -972 -291 443 1,237 18,439 7.40 Profitability Index NPV/Initial investment 2.37 New Heritage Doll Company: Capital Budgeting Exhibit 2 Selected Operating Projections for Design Your Own Doll 2010 2011 2012 2013 2014 2015 2016 2017 2018 2019 2020 Revenue 6,000 14,360 20,222 21,435 22,721 24,084 25,529 27,061 28,685 Revenue Growth 139.3% 40.8% 6.0% 6.0% 6.0% 6.0% 6.0% 6.0% Production Costs Fixed Production Expense (excl depreciation) Variable Production Costs 1,650 1,683 1,717 1,751 1,786 1,822 1,858 1,895 1,933 2,250 7,651 11,427 12,182 12,983 13,833 14,736 15,694 16,712 Depreciation Total Production Costs 310 310 310 436 462 490 520 551 584 4,210 9,644 13,454 14,369 15,231 16,145 17,113 18,140 19,229 Selling, General & Administrative Total Operating Expenses 1.201 435 1,240 2,922 4,044 4.287 4,544 4,817 5,106 5,412 5,737 1,201 435 5,450 12,566 17,498 18,656 19,775 20,962 22.219 23,553 24,966 Operating Profit -1,201 -435 550 1,794 2,724 2,779 2,946 3,123 3.310 3,509 3,719 Working Capital ASsumptions: Minimum Cash Balance as % of Sales 3.0% 3.0% 3.0% 3.0% 3.0% 3.0% 3.0% 3.0% 3.0% Days Sales Outstanding Inventory Turnover (prod. cost'ending inv.) Days Payable Outstanding (based on tot, op. exp.) 59.2x 59.2x 59.2x 59.2x 59.2x 59.2x 59.2x 59.2x 59.2x 12.2x 12.3x 12.6x 12.7x 12.7x 12.7x 12.7x 12.7x 12.7x 33.7x 33.8x 33.9x 33.9x 33.9x 33.9x 33.9x 33.9x 33.9x Capital Expenditures 4,610 310 310 2,192 826 875 928 983 1,043 1,105 Net Working Capital 2010 2011 2012 2013 2014 2015 2016 2017 2018 2019 2020 Cash 180 431 607 643 682 723 766 812 861 Accounts Receivable 973 2328 3278 3475 3683 3904 4139 4387 4650 Inventory Accounts Payable Net Working Capital 346 786 1065 1130 1197 1269 1345 1426 1512 474 1135 1598 1694 1796 1904 2018 2139 2267 1,000 1,024 2,410 3,352 3,553 3,766 3,992 4.232 4,486 4,755 ANWC 1,000 24 1,386 942 202 213 226 240 254 269 NPV Analysis FBIT*(1-T) Depreciation ANWC Capital Expenditure Operating Cash Flow -721 -261 330 1077 1634 1668 1767 1874 1986 2105 2231 310 310 310 436 462 490 520 551 584 1000 24 1,386 942 202 213 226 240 254 269 4,610 310 310 2,192 826 875 928 983 1,043 1,105 -5,331 -1.261 306 -309 -1.190 1,076 1.141 1.210 1.283 1.359 1,441 Perpetual growth rate Discount factor 3% 9.00% 1 0.91743119 0.84167999 0.77218348 0.70842521 0.64993139 0.59626733 0.54703424 0.50186628 0.46042778 0.422410807 Terminal value 24,738 Initial outlays Net working capital 10,450 Present Value Net Present Value net of terminal value Net Present Value -5,331 -1,157 258 -239 -843 700 681 662 644 626 609 -3,391 7,059 IRR Analysis 2010 2011 2012 2013 2014 2015 2016 2017 2018 2019 2020 Cash Flows IRR -5,331 -1,261 306 -309 -1,190 1.076 1,141 1,210 1,283 1,359 26,179 18% Payback Analysis Cash Flows Cumulative cash flows -5,331 -1,261 306 -309 -1,190 1,076 1,141 1,210 1,283 1,359 26,179 -5,331 -6,592 -6,286 -6,595 -7,784 -6,708 -5,566 -4,356 -3,074 -1,714 24,464 9.07 Profitability Index NPV/Initial investment 1.32 New Heritage Doll Company: Capital Budgeting NPV Sensitivity Analyses NPV of Match My Doll Clothing Line Extension NPV if TV growth rate TV=BV of Discount rate 0% 1% 2% 3% NWC + PPE 7.70% 8.40% 9.00% NPV of Design Your Own Doll NPV if TV growth rate TV=BV of Discount rate 0% 1% 2% 3% NWC + PPE 7.70% 8.40% 9.00% New Heritage Doll Company: Capital Budgeting Exhibit 1 Selected Operating Projections for Match My Doll Clothing Line Expansion 2010 2011 2012 2013 2014 2015 2016 2017 2018 2019 2020 Revenue 4,500 6,860 8,409 9,082 9,808 10,593 11,440 12,355 13,344 14,411 Revenue Growth 52.4% 22.6% 8.0% 8.0% 8.0% 8.0% 8.0% 8.0% 8.0% Production Costs Fixed Production Expense (excl depreciation) Variable Production Costs Depreciation 575 575 587 598 610 622 635 648 660 674 2,035 3,404 4,291 4,669 5,078 5,521 6,000 6,519 7,079 7,685 152 152 152 152 164 178 192 207 224 242 Total Production Costs 2,762 4,131 5,029 5,419 5,853 6,321 6,827 7,373 7,963 8,600 Selling, General & Administrative 1,250 1,155 1,735 3,336 2,102 7,132 2,270 2,452 2,648 2,860 3,089 3,603 Total Operating Expenses 1,250 3,917 5,866 7,690 8,305 8,969 9,687 10,462 11.299 12,203 Operating Profit/ EBIT -1,250 583 994 1,277 1,392 1,503 1,623 1,753 1,893 2,045 2,209 Working Capitai Assumptions: Minimum Cash Balance as % of Sales Days Sales Outstanding Inventory Tumover (prod. cost ending inv.) Days Payable Outstanding (based on tot op. exp) 3.0% 3.0% 3.0% 3.0% 3.0% 3.0% 3.0% 3.0% 3.0% 3.0% 59.2x 59.2x 59.2x 59.2x 59.2x 59.2x 59.2x 59.2x 59.2x 59.2x 7.7x 8.3x 12.7x 12,7x 12.7x 12.7x 12.7x 12.7x 12.7x 12.7x 30.8x 30.9x 31.0x 31.0x 31.0x 31.0x 31.0x 31.0x 31.0x 31.0x Capital Expenditures Initial Net Property, Plant and Equipment 952 152 152 334 361 389 421 454 491 530 1,470 Net Working Capital Cash Accounts Receivable Inventory Accounts Payable Net Working Capital 2010 2011 2012 2013 2014 2015 2016 2017 2018 2019 2020 135 206 252 272 294 318 343 371 400 432 729 1,112 1,363 1,472 1,590 1,717 1,855 2,003 2,163 2,336 360 500 396 427 461 498 538 581 627 677 317 484 593 640 692 747 807 871 941 1,016 800 907 1,334 1,418 1,531 1,653 1,786 1,929 2,083 2,250 2,429 ANWC 107 427 84 113 122 132 143 154 167 180 NPV Analysis EBIT (1-T) Depreciation ANWC Capital Expenditure Operating Cash Flow -750 350 596 766 835 902 974 1,052 1,136 1,227 1,325 152 152 152 152 164 178 192 207 224 242 107 427 84 113 122 132 143 154 167 180 952 152 152 334 361 389 421 454 491 530 -750 557 169 682 541 583 630 680 735 793 857 Perpetual growth rate Discount factor 3% 8.40% 1 0.922509225 0.8510233 0.7850768 0.7242406 0.6681186 0.6163456 0.5685845 0.5245245 0.4838786 0.44638252 Terminal value 16,345 Initial outlays Net working capital Net property plant and equipment -800 -1,470 7296 Present Value Net Present Value net of terminal value Net Present Value -3,020 -514 144 536 392 390 388 387 385 384 383 -146 7,150 IRR Analysis 2010 2011 2012 2013 2014 2015 2016 2017 2018 2019 2020 Cash Flows -3,020 -557 169 682 541 583 630 680 735 793 17,202 IRR 24% Payback Analysis Cash Flows Cumulative cash flows -3,020 -557 169 682 541 583 630 680 735 793 17,202 -3,020 -3,577 -3,408 -2,726 -2,185 -1,602 -972 -291 443 1,237 18,439 7.40 Profitability Index NPV/Initial investment 2.37 New Heritage Doll Company: Capital Budgeting Exhibit 2 Selected Operating Projections for Design Your Own Doll 2010 2011 2012 2013 2014 2015 2016 2017 2018 2019 2020 Revenue 6,000 14,360 20,222 21,435 22,721 24,084 25,529 27,061 28,685 Revenue Growth 139.3% 40.8% 6.0% 6.0% 6.0% 6.0% 6.0% 6.0% Production Costs Fixed Production Expense (excl depreciation) Variable Production Costs 1,650 1,683 1,717 1,751 1,786 1,822 1,858 1,895 1,933 2,250 7,651 11,427 12,182 12,983 13,833 14,736 15,694 16,712 Depreciation Total Production Costs 310 310 310 436 462 490 520 551 584 4,210 9,644 13,454 14,369 15,231 16,145 17,113 18,140 19,229 Selling, General & Administrative Total Operating Expenses 1.201 435 1,240 2,922 4,044 4.287 4,544 4,817 5,106 5,412 5,737 1,201 435 5,450 12,566 17,498 18,656 19,775 20,962 22.219 23,553 24,966 Operating Profit -1,201 -435 550 1,794 2,724 2,779 2,946 3,123 3.310 3,509 3,719 Working Capital ASsumptions: Minimum Cash Balance as % of Sales 3.0% 3.0% 3.0% 3.0% 3.0% 3.0% 3.0% 3.0% 3.0% Days Sales Outstanding Inventory Turnover (prod. cost'ending inv.) Days Payable Outstanding (based on tot, op. exp.) 59.2x 59.2x 59.2x 59.2x 59.2x 59.2x 59.2x 59.2x 59.2x 12.2x 12.3x 12.6x 12.7x 12.7x 12.7x 12.7x 12.7x 12.7x 33.7x 33.8x 33.9x 33.9x 33.9x 33.9x 33.9x 33.9x 33.9x Capital Expenditures 4,610 310 310 2,192 826 875 928 983 1,043 1,105 Net Working Capital 2010 2011 2012 2013 2014 2015 2016 2017 2018 2019 2020 Cash 180 431 607 643 682 723 766 812 861 Accounts Receivable 973 2328 3278 3475 3683 3904 4139 4387 4650 Inventory Accounts Payable Net Working Capital 346 786 1065 1130 1197 1269 1345 1426 1512 474 1135 1598 1694 1796 1904 2018 2139 2267 1,000 1,024 2,410 3,352 3,553 3,766 3,992 4.232 4,486 4,755 ANWC 1,000 24 1,386 942 202 213 226 240 254 269 NPV Analysis FBIT*(1-T) Depreciation ANWC Capital Expenditure Operating Cash Flow -721 -261 330 1077 1634 1668 1767 1874 1986 2105 2231 310 310 310 436 462 490 520 551 584 1000 24 1,386 942 202 213 226 240 254 269 4,610 310 310 2,192 826 875 928 983 1,043 1,105 -5,331 -1.261 306 -309 -1.190 1,076 1.141 1.210 1.283 1.359 1,441 Perpetual growth rate Discount factor 3% 9.00% 1 0.91743119 0.84167999 0.77218348 0.70842521 0.64993139 0.59626733 0.54703424 0.50186628 0.46042778 0.422410807 Terminal value 24,738 Initial outlays Net working capital 10,450 Present Value Net Present Value net of terminal value Net Present Value -5,331 -1,157 258 -239 -843 700 681 662 644 626 609 -3,391 7,059 IRR Analysis 2010 2011 2012 2013 2014 2015 2016 2017 2018 2019 2020 Cash Flows IRR -5,331 -1,261 306 -309 -1,190 1.076 1,141 1,210 1,283 1,359 26,179 18% Payback Analysis Cash Flows Cumulative cash flows -5,331 -1,261 306 -309 -1,190 1,076 1,141 1,210 1,283 1,359 26,179 -5,331 -6,592 -6,286 -6,595 -7,784 -6,708 -5,566 -4,356 -3,074 -1,714 24,464 9.07 Profitability Index NPV/Initial investment 1.32 New Heritage Doll Company: Capital Budgeting NPV Sensitivity Analyses NPV of Match My Doll Clothing Line Extension NPV if TV growth rate TV=BV of Discount rate 0% 1% 2% 3% NWC + PPE 7.70% 8.40% 9.00% NPV of Design Your Own Doll NPV if TV growth rate TV=BV of Discount rate 0% 1% 2% 3% NWC + PPE 7.70% 8.40% 9.00% New Heritage Doll Company: Capital Budgeting Exhibit 1 Selected Operating Projections for Match My Doll Clothing Line Expansion 2010 2011 2012 2013 2014 2015 2016 2017 2018 2019 2020 Revenue 4,500 6,860 8,409 9,082 9,808 10,593 11,440 12,355 13,344 14,411 Revenue Growth 52.4% 22.6% 8.0% 8.0% 8.0% 8.0% 8.0% 8.0% 8.0% Production Costs Fixed Production Expense (excl depreciation) Variable Production Costs Depreciation 575 575 587 598 610 622 635 648 660 674 2,035 3,404 4,291 4,669 5,078 5,521 6,000 6,519 7,079 7,685 152 152 152 152 164 178 192 207 224 242 Total Production Costs 2,762 4,131 5,029 5,419 5,853 6,321 6,827 7,373 7,963 8,600 Selling, General & Administrative 1,250 1,155 1,735 3,336 2,102 7,132 2,270 2,452 2,648 2,860 3,089 3,603 Total Operating Expenses 1,250 3,917 5,866 7,690 8,305 8,969 9,687 10,462 11.299 12,203 Operating Profit/ EBIT -1,250 583 994 1,277 1,392 1,503 1,623 1,753 1,893 2,045 2,209 Working Capitai Assumptions: Minimum Cash Balance as % of Sales Days Sales Outstanding Inventory Tumover (prod. cost ending inv.) Days Payable Outstanding (based on tot op. exp) 3.0% 3.0% 3.0% 3.0% 3.0% 3.0% 3.0% 3.0% 3.0% 3.0% 59.2x 59.2x 59.2x 59.2x 59.2x 59.2x 59.2x 59.2x 59.2x 59.2x 7.7x 8.3x 12.7x 12,7x 12.7x 12.7x 12.7x 12.7x 12.7x 12.7x 30.8x 30.9x 31.0x 31.0x 31.0x 31.0x 31.0x 31.0x 31.0x 31.0x Capital Expenditures Initial Net Property, Plant and Equipment 952 152 152 334 361 389 421 454 491 530 1,470 Net Working Capital Cash Accounts Receivable Inventory Accounts Payable Net Working Capital 2010 2011 2012 2013 2014 2015 2016 2017 2018 2019 2020 135 206 252 272 294 318 343 371 400 432 729 1,112 1,363 1,472 1,590 1,717 1,855 2,003 2,163 2,336 360 500 396 427 461 498 538 581 627 677 317 484 593 640 692 747 807 871 941 1,016 800 907 1,334 1,418 1,531 1,653 1,786 1,929 2,083 2,250 2,429 ANWC 107 427 84 113 122 132 143 154 167 180 NPV Analysis EBIT (1-T) Depreciation ANWC Capital Expenditure Operating Cash Flow -750 350 596 766 835 902 974 1,052 1,136 1,227 1,325 152 152 152 152 164 178 192 207 224 242 107 427 84 113 122 132 143 154 167 180 952 152 152 334 361 389 421 454 491 530 -750 557 169 682 541 583 630 680 735 793 857 Perpetual growth rate Discount factor 3% 8.40% 1 0.922509225 0.8510233 0.7850768 0.7242406 0.6681186 0.6163456 0.5685845 0.5245245 0.4838786 0.44638252 Terminal value 16,345 Initial outlays Net working capital Net property plant and equipment -800 -1,470 7296 Present Value Net Present Value net of terminal value Net Present Value -3,020 -514 144 536 392 390 388 387 385 384 383 -146 7,150 IRR Analysis 2010 2011 2012 2013 2014 2015 2016 2017 2018 2019 2020 Cash Flows -3,020 -557 169 682 541 583 630 680 735 793 17,202 IRR 24% Payback Analysis Cash Flows Cumulative cash flows -3,020 -557 169 682 541 583 630 680 735 793 17,202 -3,020 -3,577 -3,408 -2,726 -2,185 -1,602 -972 -291 443 1,237 18,439 7.40 Profitability Index NPV/Initial investment 2.37 New Heritage Doll Company: Capital Budgeting Exhibit 2 Selected Operating Projections for Design Your Own Doll 2010 2011 2012 2013 2014 2015 2016 2017 2018 2019 2020 Revenue 6,000 14,360 20,222 21,435 22,721 24,084 25,529 27,061 28,685 Revenue Growth 139.3% 40.8% 6.0% 6.0% 6.0% 6.0% 6.0% 6.0% Production Costs Fixed Production Expense (excl depreciation) Variable Production Costs 1,650 1,683 1,717 1,751 1,786 1,822 1,858 1,895 1,933 2,250 7,651 11,427 12,182 12,983 13,833 14,736 15,694 16,712 Depreciation Total Production Costs 310 310 310 436 462 490 520 551 584 4,210 9,644 13,454 14,369 15,231 16,145 17,113 18,140 19,229 Selling, General & Administrative Total Operating Expenses 1.201 435 1,240 2,922 4,044 4.287 4,544 4,817 5,106 5,412 5,737 1,201 435 5,450 12,566 17,498 18,656 19,775 20,962 22.219 23,553 24,966 Operating Profit -1,201 -435 550 1,794 2,724 2,779 2,946 3,123 3.310 3,509 3,719 Working Capital ASsumptions: Minimum Cash Balance as % of Sales 3.0% 3.0% 3.0% 3.0% 3.0% 3.0% 3.0% 3.0% 3.0% Days Sales Outstanding Inventory Turnover (prod. cost'ending inv.) Days Payable Outstanding (based on tot, op. exp.) 59.2x 59.2x 59.2x 59.2x 59.2x 59.2x 59.2x 59.2x 59.2x 12.2x 12.3x 12.6x 12.7x 12.7x 12.7x 12.7x 12.7x 12.7x 33.7x 33.8x 33.9x 33.9x 33.9x 33.9x 33.9x 33.9x 33.9x Capital Expenditures 4,610 310 310 2,192 826 875 928 983 1,043 1,105 Net Working Capital 2010 2011 2012 2013 2014 2015 2016 2017 2018 2019 2020 Cash 180 431 607 643 682 723 766 812 861 Accounts Receivable 973 2328 3278 3475 3683 3904 4139 4387 4650 Inventory Accounts Payable Net Working Capital 346 786 1065 1130 1197 1269 1345 1426 1512 474 1135 1598 1694 1796 1904 2018 2139 2267 1,000 1,024 2,410 3,352 3,553 3,766 3,992 4.232 4,486 4,755 ANWC 1,000 24 1,386 942 202 213 226 240 254 269 NPV Analysis FBIT*(1-T) Depreciation ANWC Capital Expenditure Operating Cash Flow -721 -261 330 1077 1634 1668 1767 1874 1986 2105 2231 310 310 310 436 462 490 520 551 584 1000 24 1,386 942 202 213 226 240 254 269 4,610 310 310 2,192 826 875 928 983 1,043 1,105 -5,331 -1.261 306 -309 -1.190 1,076 1.141 1.210 1.283 1.359 1,441 Perpetual growth rate Discount factor 3% 9.00% 1 0.91743119 0.84167999 0.77218348 0.70842521 0.64993139 0.59626733 0.54703424 0.50186628 0.46042778 0.422410807 Terminal value 24,738 Initial outlays Net working capital 10,450 Present Value Net Present Value net of terminal value Net Present Value -5,331 -1,157 258 -239 -843 700 681 662 644 626 609 -3,391 7,059 IRR Analysis 2010 2011 2012 2013 2014 2015 2016 2017 2018 2019 2020 Cash Flows IRR -5,331 -1,261 306 -309 -1,190 1.076 1,141 1,210 1,283 1,359 26,179 18% Payback Analysis Cash Flows Cumulative cash flows -5,331 -1,261 306 -309 -1,190 1,076 1,141 1,210 1,283 1,359 26,179 -5,331 -6,592 -6,286 -6,595 -7,784 -6,708 -5,566 -4,356 -3,074 -1,714 24,464 9.07 Profitability Index NPV/Initial investment 1.32 New Heritage Doll Company: Capital Budgeting NPV Sensitivity Analyses NPV of Match My Doll Clothing Line Extension NPV if TV growth rate TV=BV of Discount rate 0% 1% 2% 3% NWC + PPE 7.70% 8.40% 9.00% NPV of Design Your Own Doll NPV if TV growth rate TV=BV of Discount rate 0% 1% 2% 3% NWC + PPE 7.70% 8.40% 9.00% New Heritage Doll Company: Capital Budgeting Exhibit 1 Selected Operating Projections for Match My Doll Clothing Line Expansion 2010 2011 2012 2013 2014 2015 2016 2017 2018 2019 2020 Revenue 4,500 6,860 8,409 9,082 9,808 10,593 11,440 12,355 13,344 14,411 Revenue Growth 52.4% 22.6% 8.0% 8.0% 8.0% 8.0% 8.0% 8.0% 8.0% Production Costs Fixed Production Expense (excl depreciation) Variable Production Costs Depreciation 575 575 587 598 610 622 635 648 660 674 2,035 3,404 4,291 4,669 5,078 5,521 6,000 6,519 7,079 7,685 152 152 152 152 164 178 192 207 224 242 Total Production Costs 2,762 4,131 5,029 5,419 5,853 6,321 6,827 7,373 7,963 8,600 Selling, General & Administrative 1,250 1,155 1,735 3,336 2,102 7,132 2,270 2,452 2,648 2,860 3,089 3,603 Total Operating Expenses 1,250 3,917 5,866 7,690 8,305 8,969 9,687 10,462 11.299 12,203 Operating Profit/ EBIT -1,250 583 994 1,277 1,392 1,503 1,623 1,753 1,893 2,045 2,209 Working Capitai Assumptions: Minimum Cash Balance as % of Sales Days Sales Outstanding Inventory Tumover (prod. cost ending inv.) Days Payable Outstanding (based on tot op. exp) 3.0% 3.0% 3.0% 3.0% 3.0% 3.0% 3.0% 3.0% 3.0% 3.0% 59.2x 59.2x 59.2x 59.2x 59.2x 59.2x 59.2x 59.2x 59.2x 59.2x 7.7x 8.3x 12.7x 12,7x 12.7x 12.7x 12.7x 12.7x 12.7x 12.7x 30.8x 30.9x 31.0x 31.0x 31.0x 31.0x 31.0x 31.0x 31.0x 31.0x Capital Expenditures Initial Net Property, Plant and Equipment 952 152 152 334 361 389 421 454 491 530 1,470 Net Working Capital Cash Accounts Receivable Inventory Accounts Payable Net Working Capital 2010 2011 2012 2013 2014 2015 2016 2017 2018 2019 2020 135 206 252 272 294 318 343 371 400 432 729 1,112 1,363 1,472 1,590 1,717 1,855 2,003 2,163 2,336 360 500 396 427 461 498 538 581 627 677 317 484 593 640 692 747 807 871 941 1,016 800 907 1,334 1,418 1,531 1,653 1,786 1,929 2,083 2,250 2,429 ANWC 107 427 84 113 122 132 143 154 167 180 NPV Analysis EBIT (1-T) Depreciation ANWC Capital Expenditure Operating Cash Flow -750 350 596 766 835 902 974 1,052 1,136 1,227 1,325 152 152 152 152 164 178 192 207 224 242 107 427 84 113 122 132 143 154 167 180 952 152 152 334 361 389 421 454 491 530 -750 557 169 682 541 583 630 680 735 793 857 Perpetual growth rate Discount factor 3% 8.40% 1 0.922509225 0.8510233 0.7850768 0.7242406 0.6681186 0.6163456 0.5685845 0.5245245 0.4838786 0.44638252 Terminal value 16,345 Initial outlays Net working capital Net property plant and equipment -800 -1,470 7296 Present Value Net Present Value net of terminal value Net Present Value -3,020 -514 144 536 392 390 388 387 385 384 383 -146 7,150 IRR Analysis 2010 2011 2012 2013 2014 2015 2016 2017 2018 2019 2020 Cash Flows -3,020 -557 169 682 541 583 630 680 735 793 17,202 IRR 24% Payback Analysis Cash Flows Cumulative cash flows -3,020 -557 169 682 541 583 630 680 735 793 17,202 -3,020 -3,577 -3,408 -2,726 -2,185 -1,602 -972 -291 443 1,237 18,439 7.40 Profitability Index NPV/Initial investment 2.37 New Heritage Doll Company: Capital Budgeting Exhibit 2 Selected Operating Projections for Design Your Own Doll 2010 2011 2012 2013 2014 2015 2016 2017 2018 2019 2020 Revenue 6,000 14,360 20,222 21,435 22,721 24,084 25,529 27,061 28,685 Revenue Growth 139.3% 40.8% 6.0% 6.0% 6.0% 6.0% 6.0% 6.0% Production Costs Fixed Production Expense (excl depreciation) Variable Production Costs 1,650 1,683 1,717 1,751 1,786 1,822 1,858 1,895 1,933 2,250 7,651 11,427 12,182 12,983 13,833 14,736 15,694 16,712 Depreciation Total Production Costs 310 310 310 436 462 490 520 551 584 4,210 9,644 13,454 14,369 15,231 16,145 17,113 18,140 19,229 Selling, General & Administrative Total Operating Expenses 1.201 435 1,240 2,922 4,044 4.287 4,544 4,817 5,106 5,412 5,737 1,201 435 5,450 12,566 17,498 18,656 19,775 20,962 22.219 23,553 24,966 Operating Profit -1,201 -435 550 1,794 2,724 2,779 2,946 3,123 3.310 3,509 3,719 Working Capital ASsumptions: Minimum Cash Balance as % of Sales 3.0% 3.0% 3.0% 3.0% 3.0% 3.0% 3.0% 3.0% 3.0% Days Sales Outstanding Inventory Turnover (prod. cost'ending inv.) Days Payable Outstanding (based on tot, op. exp.) 59.2x 59.2x 59.2x 59.2x 59.2x 59.2x 59.2x 59.2x 59.2x 12.2x 12.3x 12.6x 12.7x 12.7x 12.7x 12.7x 12.7x 12.7x 33.7x 33.8x 33.9x 33.9x 33.9x 33.9x 33.9x 33.9x 33.9x Capital Expenditures 4,610 310 310 2,192 826 875 928 983 1,043 1,105 Net Working Capital 2010 2011 2012 2013 2014 2015 2016 2017 2018 2019 2020 Cash 180 431 607 643 682 723 766 812 861 Accounts Receivable 973 2328 3278 3475 3683 3904 4139 4387 4650 Inventory Accounts Payable Net Working Capital 346 786 1065 1130 1197 1269 1345 1426 1512 474 1135 1598 1694 1796 1904 2018 2139 2267 1,000 1,024 2,410 3,352 3,553 3,766 3,992 4.232 4,486 4,755 ANWC 1,000 24 1,386 942 202 213 226 240 254 269 NPV Analysis FBIT*(1-T) Depreciation ANWC Capital Expenditure Operating Cash Flow -721 -261 330 1077 1634 1668 1767 1874 1986 2105 2231 310 310 310 436 462 490 520 551 584 1000 24 1,386 942 202 213 226 240 254 269 4,610 310 310 2,192 826 875 928 983 1,043 1,105 -5,331 -1.261 306 -309 -1.190 1,076 1.141 1.210 1.283 1.359 1,441 Perpetual growth rate Discount factor 3% 9.00% 1 0.91743119 0.84167999 0.77218348 0.70842521 0.64993139 0.59626733 0.54703424 0.50186628 0.46042778 0.422410807 Terminal value 24,738 Initial outlays Net working capital 10,450 Present Value Net Present Value net of terminal value Net Present Value -5,331 -1,157 258 -239 -843 700 681 662 644 626 609 -3,391 7,059 IRR Analysis 2010 2011 2012 2013 2014 2015 2016 2017 2018 2019 2020 Cash Flows IRR -5,331 -1,261 306 -309 -1,190 1.076 1,141 1,210 1,283 1,359 26,179 18% Payback Analysis Cash Flows Cumulative cash flows -5,331 -1,261 306 -309 -1,190 1,076 1,141 1,210 1,283 1,359 26,179 -5,331 -6,592 -6,286 -6,595 -7,784 -6,708 -5,566 -4,356 -3,074 -1,714 24,464 9.07 Profitability Index NPV/Initial investment 1.32 New Heritage Doll Company: Capital Budgeting NPV Sensitivity Analyses NPV of Match My Doll Clothing Line Extension NPV if TV growth rate TV=BV of Discount rate 0% 1% 2% 3% NWC + PPE 7.70% 8.40% 9.00% NPV of Design Your Own Doll NPV if TV growth rate TV=BV of Discount rate 0% 1% 2% 3% NWC + PPE 7.70% 8.40% 9.00% New Heritage Doll Company: Capital Budgeting Exhibit 1 Selected Operating Projections for Match My Doll Clothing Line Expansion 2010 2011 2012 2013 2014 2015 2016 2017 2018 2019 2020 Revenue 4,500 6,860 8,409 9,082 9,808 10,593 11,440 12,355 13,344 14,411 Revenue Growth 52.4% 22.6% 8.0% 8.0% 8.0% 8.0% 8.0% 8.0% 8.0% Production Costs Fixed Production Expense (excl depreciation) Variable Production Costs Depreciation 575 575 587 598 610 622 635 648 660 674 2,035 3,404 4,291 4,669 5,078 5,521 6,000 6,519 7,079 7,685 152 152 152 152 164 178 192 207 224 242 Total Production Costs 2,762 4,131 5,029 5,419 5,853 6,321 6,827 7,373 7,963 8,600 Selling, General & Administrative 1,250 1,155 1,735 3,336 2,102 7,132 2,270 2,452 2,648 2,860 3,089 3,603 Total Operating Expenses 1,250 3,917 5,866 7,690 8,305 8,969 9,687 10,462 11.299 12,203 Operating Profit/ EBIT -1,250 583 994 1,277 1,392 1,503 1,623 1,753 1,893 2,045 2,209 Working Capitai Assumptions: Minimum Cash Balance as % of Sales Days Sales Outstanding Inventory Tumover (prod. cost ending inv.) Days Payable Outstanding (based on tot op. exp) 3.0% 3.0% 3.0% 3.0% 3.0% 3.0% 3.0% 3.0% 3.0% 3.0% 59.2x 59.2x 59.2x 59.2x 59.2x 59.2x 59.2x 59.2x 59.2x 59.2x 7.7x 8.3x 12.7x 12,7x 12.7x 12.7x 12.7x 12.7x 12.7x 12.7x 30.8x 30.9x 31.0x 31.0x 31.0x 31.0x 31.0x 31.0x 31.0x 31.0x Capital Expenditures Initial Net Property, Plant and Equipment 952 152 152 334 361 389 421 454 491 530 1,470 Net Working Capital Cash Accounts Receivable Inventory Accounts Payable Net Working Capital 2010 2011 2012 2013 2014 2015 2016 2017 2018 2019 2020 135 206 252 272 294 318 343 371 400 432 729 1,112 1,363 1,472 1,590 1,717 1,855 2,003 2,163 2,336 360 500 396 427 461 498 538 581 627 677 317 484 593 640 692 747 807 871 941 1,016 800 907 1,334 1,418 1,531 1,653 1,786 1,929 2,083 2,250 2,429 ANWC 107 427 84 113 122 132 143 154 167 180 NPV Analysis EBIT (1-T) Depreciation ANWC Capital Expenditure Operating Cash Flow -750 350 596 766 835 902 974 1,052 1,136 1,227 1,325 152 152 152 152 164 178 192 207 224 242 107 427 84 113 122 132 143 154 167 180 952 152 152 334 361 389 421 454 491 530 -750 557 169 682 541 583 630 680 735 793 857 Perpetual growth rate Discount factor 3% 8.40% 1 0.922509225 0.8510233 0.7850768 0.7242406 0.6681186 0.6163456 0.5685845 0.5245245 0.4838786 0.44638252 Terminal value 16,345 Initial outlays Net working capital Net property plant and equipment -800 -1,470 7296 Present Value Net Present Value net of terminal value Net Present Value -3,020 -514 144 536 392 390 388 387 385 384 383 -146 7,150 IRR Analysis 2010 2011 2012 2013 2014 2015 2016 2017 2018 2019 2020 Cash Flows -3,020 -557 169 682 541 583 630 680 735 793 17,202 IRR 24% Payback Analysis Cash Flows Cumulative cash flows -3,020 -557 169 682 541 583 630 680 735 793 17,202 -3,020 -3,577 -3,408 -2,726 -2,185 -1,602 -972 -291 443 1,237 18,439 7.40 Profitability Index NPV/Initial investment 2.37 New Heritage Doll Company: Capital Budgeting Exhibit 2 Selected Operating Projections for Design Your Own Doll 2010 2011 2012 2013 2014 2015 2016 2017 2018 2019 2020 Revenue 6,000 14,360 20,222 21,435 22,721 24,084 25,529 27,061 28,685 Revenue Growth 139.3% 40.8% 6.0% 6.0% 6.0% 6.0% 6.0% 6.0% Production Costs Fixed Production Expense (excl depreciation) Variable Production Costs 1,650 1,683 1,717 1,751 1,786 1,822 1,858 1,895 1,933 2,250 7,651 11,427 12,182 12,983 13,833 14,736 15,694 16,712 Depreciation Total Production Costs 310 310 310 436 462 490 520 551 584 4,210 9,644 13,454 14,369 15,231 16,145 17,113 18,140 19,229 Selling, General & Administrative Total Operating Expenses 1.201 435 1,240 2,922 4,044 4.287 4,544 4,817 5,106 5,412 5,737 1,201 435 5,450 12,566 17,498 18,656 19,775 20,962 22.219 23,553 24,966 Operating Profit -1,201 -435 550 1,794 2,724 2,779 2,946 3,123 3.310 3,509 3,719 Working Capital ASsumptions: Minimum Cash Balance as % of Sales 3.0% 3.0% 3.0% 3.0% 3.0% 3.0% 3.0% 3.0% 3.0% Days Sales Outstanding Inventory Turnover (prod. cost'ending inv.) Days Payable Outstanding (based on tot, op. exp.) 59.2x 59.2x 59.2x 59.2x 59.2x 59.2x 59.2x 59.2x 59.2x 12.2x 12.3x 12.6x 12.7x 12.7x 12.7x 12.7x 12.7x 12.7x 33.7x 33.8x 33.9x 33.9x 33.9x 33.9x 33.9x 33.9x 33.9x Capital Expenditures 4,610 310 310 2,192 826 875 928 983 1,043 1,105 Net Working Capital 2010 2011 2012 2013 2014 2015 2016 2017 2018 2019 2020 Cash 180 431 607 643 682 723 766 812 861 Accounts Receivable 973 2328 3278 3475 3683 3904 4139 4387 4650 Inventory Accounts Payable Net Working Capital 346 786 1065 1130 1197 1269 1345 1426 1512 474 1135 1598 1694 1796 1904 2018 2139 2267 1,000 1,024 2,410 3,352 3,553 3,766 3,992 4.232 4,486 4,755 ANWC 1,000 24 1,386 942 202 213 226 240 254 269 NPV Analysis FBIT*(1-T) Depreciation ANWC Capital Expenditure Operating Cash Flow -721 -261 330 1077 1634 1668 1767 1874 1986 2105 2231 310 310 310 436 462 490 520 551 584 1000 24 1,386 942 202 213 226 240 254 269 4,610 310 310 2,192 826 875 928 983 1,043 1,105 -5,331 -1.261 306 -309 -1.190 1,076 1.141 1.210 1.283 1.359 1,441 Perpetual growth rate Discount factor 3% 9.00% 1 0.91743119 0.84167999 0.77218348 0.70842521 0.64993139 0.59626733 0.54703424 0.50186628 0.46042778 0.422410807 Terminal value 24,738 Initial outlays Net working capital 10,450 Present Value Net Present Value net of terminal value Net Present Value -5,331 -1,157 258 -239 -843 700 681 662 644 626 609 -3,391 7,059 IRR Analysis 2010 2011 2012 2013 2014 2015 2016 2017 2018 2019 2020 Cash Flows IRR -5,331 -1,261 306 -309 -1,190 1.076 1,141 1,210 1,283 1,359 26,179 18% Payback Analysis Cash Flows Cumulative cash flows -5,331 -1,261 306 -309 -1,190 1,076 1,141 1,210 1,283 1,359 26,179 -5,331 -6,592 -6,286 -6,595 -7,784 -6,708 -5,566 -4,356 -3,074 -1,714 24,464 9.07 Profitability Index NPV/Initial investment 1.32 New Heritage Doll Company: Capital Budgeting NPV Sensitivity Analyses NPV of Match My Doll Clothing Line Extension NPV if TV growth rate TV=BV of Discount rate 0% 1% 2% 3% NWC + PPE 7.70% 8.40% 9.00% NPV of Design Your Own Doll NPV if TV growth rate TV=BV of Discount rate 0% 1% 2% 3% NWC + PPE 7.70% 8.40% 9.00% New Heritage Doll Company: Capital Budgeting Exhibit 1 Selected Operating Projections for Match My Doll Clothing Line Expansion 2010 2011 2012 2013 2014 2015 2016 2017 2018 2019 2020 Revenue 4,500 6,860 8,409 9,082 9,808 10,593 11,440 12,355 13,344 14,411 Revenue Growth 52.4% 22.6% 8.0% 8.0% 8.0% 8.0% 8.0% 8.0% 8.0% Production Costs Fixed Production Expense (excl depreciation) Variable Production Costs Depreciation 575 575 587 598 610 622 635 648 660 674 2,035 3,404 4,291 4,669 5,078 5,521 6,000 6,519 7,079 7,685 152 152 152 152 164 178 192 207 224 242 Total Production Costs 2,762 4,131 5,029 5,419 5,853 6,321 6,827 7,373 7,963 8,600 Selling, General & Administrative 1,250 1,155 1,735 3,336 2,102 7,132 2,270 2,452 2,648 2,860 3,089 3,603 Total Operating Expenses 1,250 3,917 5,866 7,690 8,305 8,969 9,687 10,462 11.299 12,203 Operating Profit/ EBIT -1,250 583 994 1,277 1,392 1,503 1,623 1,753 1,893 2,045 2,209 Working Capitai Assumptions: Minimum Cash Balance as % of Sales Days Sales Outstanding Inventory Tumover (prod. cost ending inv.) Days Payable Outstanding (based on tot op. exp) 3.0% 3.0% 3.0% 3.0% 3.0% 3.0% 3.0% 3.0% 3.0% 3.0% 59.2x 59.2x 59.2x 59.2x 59.2x 59.2x 59.2x 59.2x 59.2x 59.2x 7.7x 8.3x 12.7x 12,7x 12.7x 12.7x 12.7x 12.7x 12.7x 12.7x 30.8x 30.9x 31.0x 31.0x 31.0x 31.0x 31.0x 31.0x 31.0x 31.0x Capital Expenditures Initial Net Property, Plant and Equipment 952 152 152 334 361 389 421 454 491 530 1,470 Net Working Capital Cash Accounts Receivable Inventory Accounts Payable Net Working Capital 2010 2011 2012 2013 2014 2015 2016 2017 2018 2019 2020 135 206 252 272 294 318 343 371 400 432 729 1,112 1,363 1,472 1,590 1,717 1,855 2,003 2,163 2,336 360 500 396 427 461 498 538 581 627 677 317 484 593 640 692 747 807 871 941 1,016 800 907 1,334 1,418 1,531 1,653 1,786 1,929 2,083 2,250 2,429 ANWC 107 427 84 113 122 132 143 154 167 180 NPV Analysis EBIT (1-T) Depreciation ANWC Capital Expenditure Operating Cash Flow -750 350 596 766 835 902 974 1,052 1,136 1,227 1,325 152 152 152 152 164 178 192 207 224 242 107 427 84 113 122 132 143 154 167 180 952 152 152 334 361 389 421 454 491 530 -750 557 169 682 541 583 630 680 735 793 857 Perpetual growth rate Discount factor 3% 8.40% 1 0.922509225 0.8510233 0.7850768 0.7242406 0.6681186 0.6163456 0.5685845 0.5245245 0.4838786 0.44638252 Terminal value 16,345 Initial outlays Net working capital Net property plant and equipment -800 -1,470 7296 Present Value Net Present Value net of terminal value Net Present Value -3,020 -514 144 536 392 390 388 387 385 384 383 -146 7,150 IRR Analysis 2010 2011 2012 2013 2014 2015 2016 2017 2018 2019 2020 Cash Flows -3,020 -557 169 682 541 583 630 680 735 793 17,202 IRR 24% Payback Analysis Cash Flows Cumulative cash flows -3,020 -557 169 682 541 583 630 680 735 793 17,202 -3,020 -3,577 -3,408 -2,726 -2,185 -1,602 -972 -291 443 1,237 18,439 7.40 Profitability Index NPV/Initial investment 2.37 New Heritage Doll Company: Capital Budgeting Exhibit 2 Selected Operating Projections for Design Your Own Doll 2010 2011 2012 2013 2014 2015 2016 2017 2018 2019 2020 Revenue 6,000 14,360 20,222 21,435 22,721 24,084 25,529 27,061 28,685 Revenue Growth 139.3% 40.8% 6.0% 6.0% 6.0% 6.0% 6.0% 6.0% Production Costs Fixed Production Expense (excl depreciation) Variable Production Costs 1,650 1,683 1,717 1,751 1,786 1,822 1,858 1,895 1,933 2,250 7,651 11,427 12,182 12,983 13,833 14,736 15,694 16,712 Depreciation Total Production Costs 310 310 310 436 462 490 520 551 584 4,210 9,644 13,454 14,369 15,231 16,145 17,113 18,140 19,229 Selling, General & Administrative Total Operating Expenses 1.201 435 1,240 2,922 4,044 4.287 4,544 4,817 5,106 5,412 5,737 1,201 435 5,450 12,566 17,498 18,656 19,775 20,962 22.219 23,553 24,966 Operating Profit -1,201 -435 550 1,794 2,724 2,779 2,946 3,123 3.310 3,509 3,719 Working Capital ASsumptions: Minimum Cash Balance as % of Sales 3.0% 3.0% 3.0% 3.0% 3.0% 3.0% 3.0% 3.0% 3.0% Days Sales Outstanding Inventory Turnover (prod. cost'ending inv.) Days Payable Outstanding (based on tot, op. exp.) 59.2x 59.2x 59.2x 59.2x 59.2x 59.2x 59.2x 59.2x 59.2x 12.2x 12.3x 12.6x 12.7x 12.7x 12.7x 12.7x 12.7x 12.7x 33.7x 33.8x 33.9x 33.9x 33.9x 33.9x 33.9x 33.9x 33.9x Capital Expenditures 4,610 310 310 2,192 826 875 928 983 1,043 1,105 Net Working Capital 2010 2011 2012 2013 2014 2015 2016 2017 2018 2019 2020 Cash 180 431 607 643 682 723 766 812 861 Accounts Receivable 973 2328 3278 3475 3683 3904 4139 4387 4650 Inventory Accounts Payable Net Working Capital 346 786 1065 1130 1197 1269 1345 1426 1512 474 1135 1598 1694 1796 1904 2018 2139 2267 1,000 1,024 2,410 3,352 3,553 3,766 3,992 4.232 4,486 4,755 ANWC 1,000 24 1,386 942 202 213 226 240 254 269 NPV Analysis FBIT*(1-T) Depreciation ANWC Capital Expenditure Operating Cash Flow -721 -261 330 1077 1634 1668 1767 1874 1986 2105 2231 310 310 310 436 462 490 520 551 584 1000 24 1,386 942 202 213 226 240 254 269 4,610 310 310 2,192 826 875 928 983 1,043 1,105 -5,331 -1.261 306 -309 -1.190 1,076 1.141 1.210 1.283 1.359 1,441 Perpetual growth rate Discount factor 3% 9.00% 1 0.91743119 0.84167999 0.77218348 0.70842521 0.64993139 0.59626733 0.54703424 0.50186628 0.46042778 0.422410807 Terminal value 24,738 Initial outlays Net working capital 10,450 Present Value Net Present Value net of terminal value Net Present Value -5,331 -1,157 258 -239 -843 700 681 662 644 626 609 -3,391 7,059 IRR Analysis 2010 2011 2012 2013 2014 2015 2016 2017 2018 2019 2020 Cash Flows IRR -5,331 -1,261 306 -309 -1,190 1.076 1,141 1,210 1,283 1,359 26,179 18% Payback Analysis Cash Flows Cumulative cash flows -5,331 -1,261 306 -309 -1,190 1,076 1,141 1,210 1,283 1,359 26,179 -5,331 -6,592 -6,286 -6,595 -7,784 -6,708 -5,566 -4,356 -3,074 -1,714 24,464 9.07 Profitability Index NPV/Initial investment 1.32 New Heritage Doll Company: Capital Budgeting NPV Sensitivity Analyses NPV of Match My Doll Clothing Line Extension NPV if TV growth rate TV=BV of Discount rate 0% 1% 2% 3% NWC + PPE 7.70% 8.40% 9.00% NPV of Design Your Own Doll NPV if TV growth rate TV=BV of Discount rate 0% 1% 2% 3% NWC + PPE 7.70% 8.40% 9.00% New Heritage Doll Company: Capital Budgeting Exhibit 1 Selected Operating Projections for Match My Doll Clothing Line Expansion 2010 2011 2012 2013 2014 2015 2016 2017 2018 2019 2020 Revenue 4,500 6,860 8,409 9,082 9,808 10,593 11,440 12,355 13,344 14,411 Revenue Growth 52.4% 22.6% 8.0% 8.0% 8.0% 8.0% 8.0% 8.0% 8.0% Production Costs Fixed Production Expense (excl depreciation) Variable Production Costs Depreciation 575 575 587 598 610 622 635 648 660 674 2,035 3,404 4,291 4,669 5,078 5,521 6,000 6,519 7,079 7,685 152 152 152 152 164 178 192 207 224 242 Total Production Costs 2,762 4,131 5,029 5,419 5,853 6,321 6,827 7,373 7,963 8,600 Selling, General & Administrative 1,250 1,155 1,735 3,336 2,102 7,132 2,270 2,452 2,648 2,860 3,089 3,603 Total Operating Expenses 1,250 3,917 5,866 7,690 8,305 8,969 9,687 10,462 11.299 12,203 Operating Profit/ EBIT -1,250 583 994 1,277 1,392 1,503 1,623 1,753 1,893 2,045 2,209 Working Capitai Assumptions: Minimum Cash Balance as % of Sales Days Sales Outstanding Inventory Tumover (prod. cost ending inv.) Days Payable Outstanding (based on tot op. exp) 3.0% 3.0% 3.0% 3.0% 3.0% 3.0% 3.0% 3.0% 3.0% 3.0% 59.2x 59.2x 59.2x 59.2x 59.2x 59.2x 59.2x 59.2x 59.2x 59.2x 7.7x 8.3x 12.7x 12,7x 12.7x 12.7x 12.7x 12.7x 12.7x 12.7x 30.8x 30.9x 31.0x 31.0x 31.0x 31.0x 31.0x 31.0x 31.0x 31.0x Capital Expenditures Initial Net Property, Plant and Equipment 952 152 152 334 361 389 421 454 491 530 1,470 Net Working Capital Cash Accounts Receivable Inventory Accounts Payable Net Working Capital 2010 2011 2012 2013 2014 2015 2016 2017 2018 2019 2020 135 206 252 272 294 318 343 371 400 432 729 1,112 1,363 1,472 1,590 1,717 1,855 2,003 2,163 2,336 360 500 396 427 461 498 538 581 627 677 317 484 593 640 692 747 807 871 941 1,016 800 907 1,334 1,418 1,531 1,653 1,786 1,929 2,083 2,250 2,429 ANWC 107 427 84 113 122 132 143 154 167 180 NPV Analysis EBIT (1-T) Depreciation ANWC Capital Expenditure Operating Cash Flow -750 350 596 766 835 902 974 1,052 1,136 1,227 1,325 152 152 152 152 164 178 192 207 224 242 107 427 84 113 122 132 143 154 167 180 952 152 152 334 361 389 421 454 491 530 -750 557 169 682 541 583 630 680 735 793 857 Perpetual growth rate Discount factor 3% 8.40% 1 0.922509225 0.8510233 0.7850768 0.7242406 0.6681186 0.6163456 0.5685845 0.5245245 0.4838786 0.44638252 Terminal value 16,345 Initial outlays Net working capital Net property plant and equipment -800 -1,470 7296 Present Value Net Present Value net of terminal value Net Present Value -3,020 -514 144 536 392 390 388 387 385 384 383 -146 7,150 IRR Analysis 2010 2011 2012 2013 2014 2015 2016 2017 2018 2019 2020 Cash Flows -3,020 -557 169 682 541 583 630 680 735 793 17,202 IRR 24% Payback Analysis Cash Flows Cumulative cash flows -3,020 -557 169 682 541 583 630 680 735 793 17,202 -3,020 -3,577 -3,408 -2,726 -2,185 -1,602 -972 -291 443 1,237 18,439 7.40 Profitability Index NPV/Initial investment 2.37 New Heritage Doll Company: Capital Budgeting Exhibit 2 Selected Operating Projections for Design Your Own Doll 2010 2011 2012 2013 2014 2015 2016 2017 2018 2019 2020 Revenue 6,000 14,360 20,222 21,435 22,721 24,084 25,529 27,061 28,685 Revenue Growth 139.3% 40.8% 6.0% 6.0% 6.0% 6.0% 6.0% 6.0% Production Costs Fixed Production Expense (excl depreciation) Variable Production Costs 1,650 1,683 1,717 1,751 1,786 1,822 1,858 1,895 1,933 2,250 7,651 11,427 12,182 12,983 13,833 14,736 15,694 16,712 Depreciation Total Production Costs 310 310 310 436 462 490 520 551 584 4,210 9,644 13,454 14,369 15,231 16,145 17,113 18,140 19,229 Selling, General & Administrative Total Operating Expenses 1.201 435 1,240 2,922 4,044 4.287 4,544 4,817 5,106 5,412 5,737 1,201 435 5,450 12,566 17,498 18,656 19,775 20,962 22.219 23,553 24,966 Operating Profit -1,201 -435 550 1,794 2,724 2,779 2,946 3,123 3.310 3,509 3,719 Working Capital ASsumptions: Minimum Cash Balance as % of Sales 3.0% 3.0% 3.0% 3.0% 3.0% 3.0% 3.0% 3.0% 3.0% Days Sales Outstanding Inventory Turnover (prod. cost'ending inv.) Days Payable Outstanding (based on tot, op. exp.) 59.2x 59.2x 59.2x 59.2x 59.2x 59.2x 59.2x 59.2x 59.2x 12.2x 12.3x 12.6x 12.7x 12.7x 12.7x 12.7x 12.7x 12.7x 33.7x 33.8x 33.9x 33.9x 33.9x 33.9x 33.9x 33.9x 33.9x Capital Expenditures 4,610 310 310 2,192 826 875 928 983 1,043 1,105 Net Working Capital 2010 2011 2012 2013 2014 2015 2016 2017 2018 2019 2020 Cash 180 431 607 643 682 723 766 812 861 Accounts Receivable 973 2328 3278 3475 3683 3904 4139 4387 4650 Inventory Accounts Payable Net Working Capital 346 786 1065 1130 1197 1269 1345 1426 1512 474 1135 1598 1694 1796 1904 2018 2139 2267 1,000 1,024 2,410 3,352 3,553 3,766 3,992 4.232 4,486 4,755 ANWC 1,000 24 1,386 942 202 213 226 240 254 269 NPV Analysis FBIT*(1-T) Depreciation ANWC Capital Expenditure Operating Cash Flow -721 -261 330 1077 1634 1668 1767 1874 1986 2105 2231 310 310 310 436 462 490 520 551 584 1000 24 1,386 942 202 213 226 240 254 269 4,610 310 310 2,192 826 875 928 983 1,043 1,105 -5,331 -1.261 306 -309 -1.190 1,076 1.141 1.210 1.283 1.359 1,441 Perpetual growth rate Discount factor 3% 9.00% 1 0.91743119 0.84167999 0.77218348 0.70842521 0.64993139 0.59626733 0.54703424 0.50186628 0.46042778 0.422410807 Terminal value 24,738 Initial outlays Net working capital 10,450 Present Value Net Present Value net of terminal value Net Present Value -5,331 -1,157 258 -239 -843 700 681 662 644 626 609 -3,391 7,059 IRR Analysis 2010 2011 2012 2013 2014 2015 2016 2017 2018 2019 2020 Cash Flows IRR -5,331 -1,261 306 -309 -1,190 1.076 1,141 1,210 1,283 1,359 26,179 18% Payback Analysis Cash Flows Cumulative cash flows -5,331 -1,261 306 -309 -1,190 1,076 1,141 1,210 1,283 1,359 26,179 -5,331 -6,592 -6,286 -6,595 -7,784 -6,708 -5,566 -4,356 -3,074 -1,714 24,464 9.07 Profitability Index NPV/Initial investment 1.32
Expert Answer:
Answer rating: 100% (QA)
ar 0 1 2 3 4 5 6 7 8 9 10 TV NPV NPV NPV NPV NPV Initial Outlay Operating cash flows 302... View the full answer

Related Book For 
Posted Date:
Students also viewed these general management questions
-
QUESTION 2 A company reported the following information: Salaries payable, December 31, 2014 Salaries payable, December 31, 2013 Salaries expense for 2014 How much cash was paid for salaries during...
-
Nucor Corporation produces steel and steel products at its eight mills and is a major recycler of scrap metal. The following data relate to Nucor for four years. Nucor Corporation (S in millions)...
-
Financing that individuals or institutions have provided to a corporation is: a. classified as a stockholders' equity when provided by creditors and liability when provided by owners b. always...
-
In the Edgeworth production box diagram, what conditions must hold for an allocation to be on the production contract curve? Why is a competitive equilibrium on the contract curve?
-
Using the present value and future value tables, a financial calculator, or a spreadsheet, answer the following questions. a. $ 200,000 is to be received five years from today. What is the PV of this...
-
1. How might different types of office design influence employee social interaction, collaboration, and creativity? Should these be encouraged even in organizations without an innovative culture? 2....
-
Which of the following deformations are reversible and which are irreversible: (a) the deformation of a tennis ball against a racquet, \((b)\) the deformation of a car fender during a traffic...
-
Michaels Corporation expects earnings before interest and taxes to be $40,000 for the current period. Assuming an ordinary tax rate of 40%, compute the firms earnings after taxes and earnings...
-
1. Consider the problem of returning change to a customer requiring the smallest number of coins. a. Show that the greedy algorithm given below returns the smallest number of coins for the coin set...
-
Each of the following reactions has been reported in the chemical literature. Predict the product in each case, showing stereochemistry where appropriate. (a) CHs CH hea (b) (CH3)2(-C(CH3): T -...
-
Read the following resource on recreational math and then write your reaction to it. Lane, M. (2009, October 28). Martin Gardner and the three way duel [Blog post]. Available at...
-
Revenue-sharing contracts usually result in the supply chain producing to consumer demand. higher cost of returns. lower retailer profit. lower retailer effort.
-
Walmart has worked to convert ________ at its stores from a cost to a profit generator. energy usage waste generation water consumption packaging
-
Price has traditionally been the only dimension that suppliers have been compared on during the process of supplier scoring and assessment. sourcing. procurement. supplier selection.
-
A third party may increase the supply chain surplus by aggregating warehousing needs over several firms. This is called capacity aggregation. inventory aggregation. warehouse aggregation....
-
Good design collaboration for manufacturability and supply chain can increase required inventories. reduce product cost. increase transportation cost. decrease manufacturability.
-
Q.1 What are they key components of globalization, and how can they influence collective bargaining? Q. 12 What recent events led to higher wages in China?
-
Why do CPA firms sometimes use a combination of positive and negative confirmations on the same audit?
-
What forces may lead to the breakup of an employer (monopsony) cartel?
-
What is the difference between a change in the quantity supplied of Real GDP and a change in short-run aggregate supply?
-
Describe the relationship of the (actual) unemployment rate to the natural unemployment rate in each of the following economic states: (a) a recessionary gap, (b) an inflationary gap, and (c)...
-
Consider the feedback system shown in Figure 10.27. Using Routh's stability criterion, determine the range of the control gain \(K\) for which the closed-loop system is stable. FIGURE 10.27 Problem...
-
Draw a block diagram for the feedback control of a single-link robot arm system, which consists of a DC motor to produce the driving force and an encoder to measure the joint angle. Clearly label...
-
The transfer function of a dynamic system is given by \[G(s)=\frac{20 s+50}{s^{3}+10 s^{2}-5 s-30}\] a. Using Routh's stability criterion, determine the stability of the open-loop system. b. Suppose...

Study smarter with the SolutionInn App