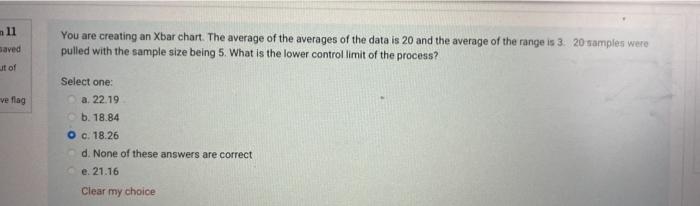
Question: ni aved You are creating an Xbar chart. The average of the averages of the data is 20 and the average of the range is

ni aved You are creating an Xbar chart. The
ni aved You are creating an Xbar chart. The average of the averages of the data is 20 and the average of the range is 3. 20 samples were pulled with the sample size being 5. What is the lower controllimit of the process? ut of ve flag Select one: a. 22.19 b. 18.84 O c. 18.26 d. None of these answers are correct e 21.16 Clear my choice

Step by Step Solution

There are 3 Steps involved in it

1 Expert Approved Answer
Step: 1 Unlock blur-text-image
Question Has Been Solved by an Expert!

Get step-by-step solutions from verified subject matter experts

Step: 2 Unlock
Step: 3 Unlock

Students Have Also Explored These Related General Management Questions!