

Question: (note: I need the calculation in handwritting) Problem 4: The data in the following table give the number of nonconforming bearing and seal assemblies in
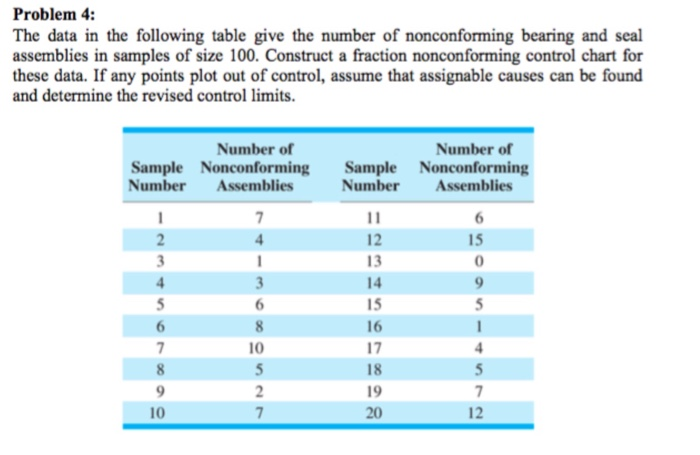
(note: I need the calculation in handwritting)
Step by Step Solution
There are 3 Steps involved in it
1 Expert Approved Answer
Step: 1 Unlock

Question Has Been Solved by an Expert!
Get step-by-step solutions from verified subject matter experts
Step: 2 Unlock
Step: 3 Unlock